Ralph Nelson Elliott is the father of Elliott Wave Theory, but before he gave life to the theory that millions of investors around the world study today, he was a humble accountant who worked in Central America and Mexico, training executives during the 1890s.
Eventually, Elliott married and moved back to the United States, and in 1920 he was hired by the United States Department of State to perform accounting and financial restructuring services for Nicaragua. During this period, he added the title “author” to his resume, penning two books on social and economic issues in Central America.
His works, “Tea Room and Cafeteria Management” and “The Future of Latin America” weren’t best sellers, but they were important in their way and laid the foundation for what Elliott would do later.
He retired at the age of 58 and by 1930 had devoted himself to studying the behavior of the US stock market. Elliott Wave Theory was born of an intense study of some seventy-five years’ worth of historical data for both US stocks and stock indices, including yearly, monthly, weekly, hourly and half-hour charts.
In 1938 he published his third book with Charles J. Collins, called “The Wave Principle.” The central premise of this work was that while a given stock’s price may appear to be completely random, it can, in fact, be measured and forecasted using the patterns of prices and Fibonacci numbers. His book broke down thirteen different price patterns and used them to explain how the market works.
Shortly after the publication of “The Wave Principle,” Elliott wrote an article for the Financial World magazine, which described his method of forecasting the market.
In the early 1940s, Elliott expanded his theory to apply to human behavior as a whole. His last major work was also his most comprehensive: “Laws of Nature – Secrets of the Universe,” published in 1946, just two years prior to his death.
In the years following Elliott’s death, other analysts, including Charles Collins, Hamilton Bolton, Richard Russell, and AJ Frost dedicated themselves to Elliott’s methods and continued to refine the models he created, applying wave principles to investors’ forecasts.
Robert Prechter discovered Elliott’s work as a market analyst at Merrill Lynch and used it as the basis for his 1978 book, “The Elliott Wave Principle,” co-written with AJ Frost. Prechter’s dominance as an analyst during the uptrend of the 1980s made his book, and Wave Principles in general, quite famous.
Over the years, the Elliott wave has continued to be somewhat controversial, with proponents swearing by it as an analytic tool and detractors decrying it as being too vague and subjective to be of genuine value.
It should be noted that most of the people who criticized the work didn’t benefit from it or truly understand how the Elliott Wave works, but after more than nine decades of use, time has proven the validity of the wave principle. It remains one of the fundamental tools of market analysis today.
The Elliott Wave is one of the principles of market infrastructure analysis. One thing that most people get wrong about it though, is in assuming that an Elliott Wave chart is like a navigational chart or the directions you get from Google Maps, which will show you point to point how to get to your ultimate destination.
In truth, Elliott Waves are more like helicopter rides from one location to another. When you’re in the air, you can see where and how all the roads below converge and split.
Elliott Wave fundamentals consist of up and down or sideways moving steps from the point where the price has moved to a point where the price currently is. Up to the point where there is a change in direction, we define as 1 wave. That wave terminates when the movement changes directions, which marks the beginning of a new wave.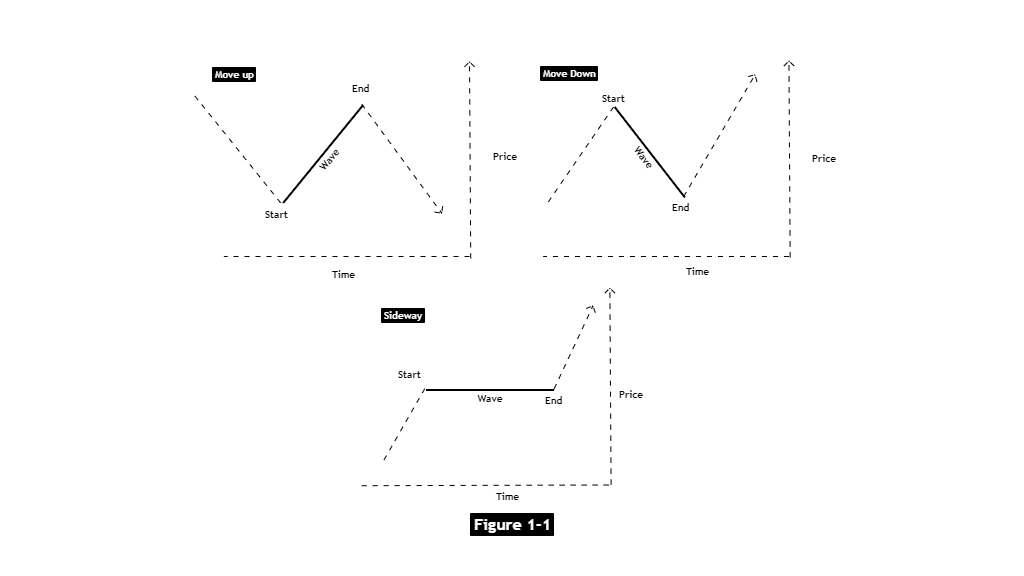
Waves can be stretched or compressed by the ratio of time and price, but the price pattern is always fixed, regardless of whether it is a larger or smaller timeframe.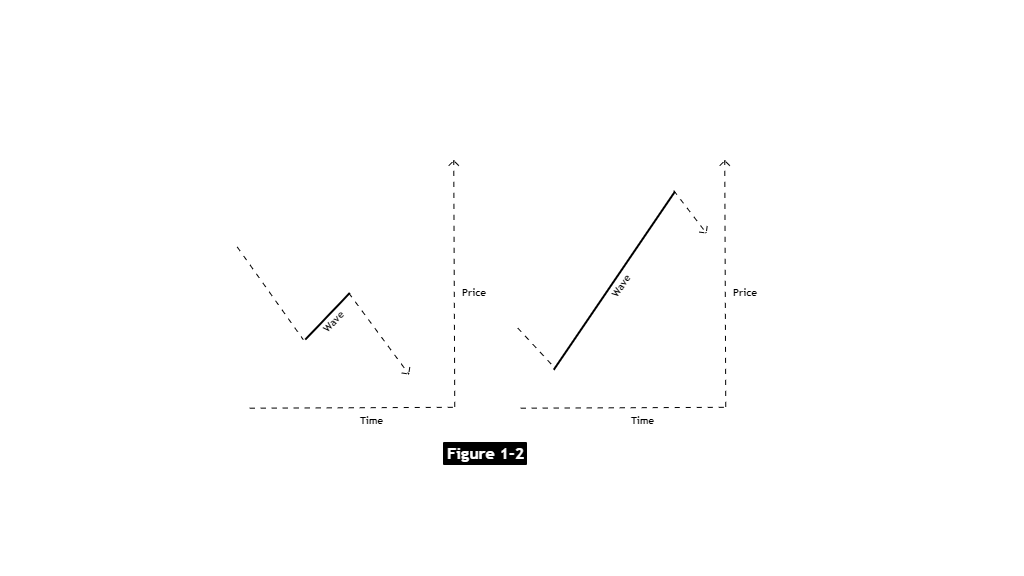
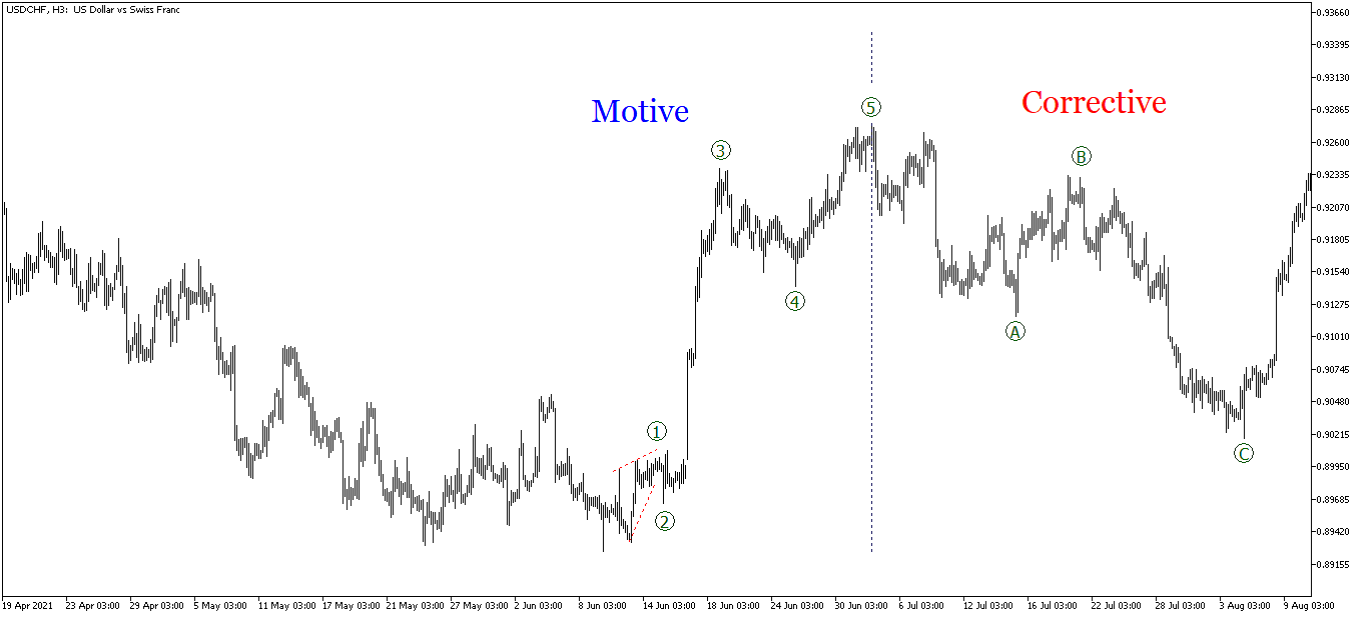
The combination of waves produces a motion and that motion is never a straight line. Price moves in a given direction for a time, then it stops and changes direction, creating a “saw-toothed” pattern. Here, we see a classic five-wave pattern with waves 1, 3, and 5 sharing directionality that is interrupted by waves 2 and 4.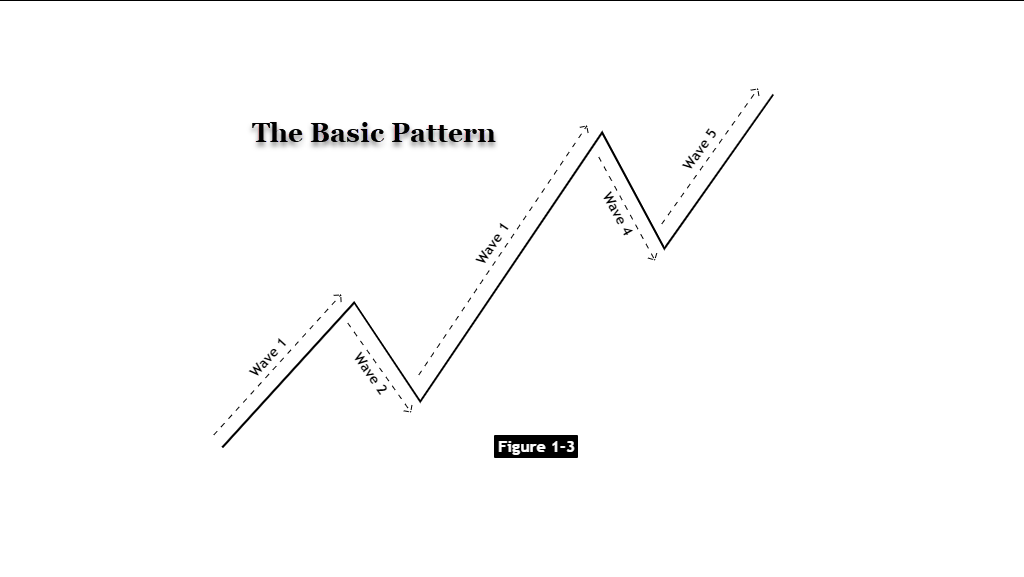
Waves are defined as being in one of two modes: Motive and Corrective. Motive waves have a 5-wave structure, while corrective waves have a 3-wave structure. Motive waves extend in the same direction as the main (overarching) trend and are labeled with internal numbers. It consists of three waves in the same direction (1, 3, and 5), and two waves running in the opposite direction (2,4). The corrective is the effect of the previous motive being labeled with the letters and moving opposite to the direction of the main trend.
Within the Corrective wave, you’ll find two waves in the same direction (A, and C) interrupted by an oppositional wave (B), like this: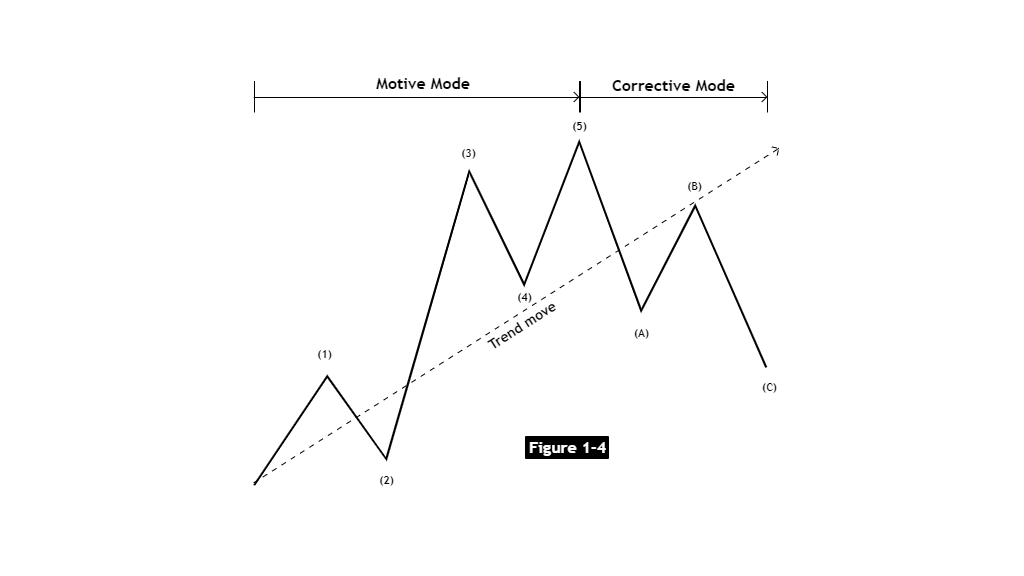
When both the Motive and Corrective patterns are complete, they become part of the structure of the larger wave level. Therefore, the two modes are different in terms of their fundamentals, roles and structure.
One complete cycle consists of two phases of eight waves.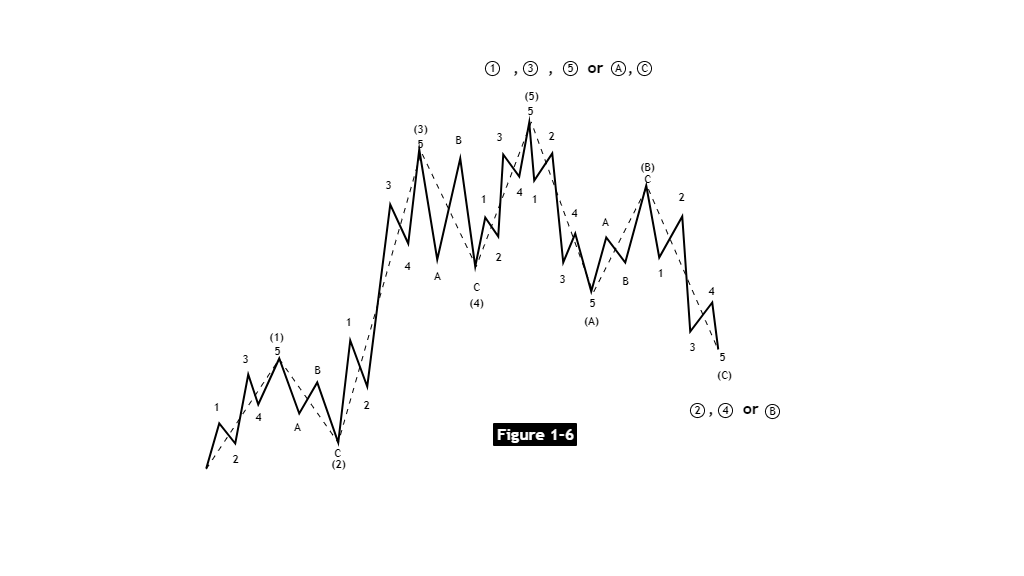
And when complete, it becomes part of the larger scale wave.
Note that Motive waves don’t always have to consist of five waves and Corrective waves don’t always have to consist of three. These are merely the minimum requirements for Motive and Corrective waveforms and is explained in the amplification and compound wave series.
Motive waves do not always point “upward” and Corrective waves do not always point “downward.” Wave behavior is not determined by travel in a certain direction, but in principle, it is determined by direction relative to the trend and the surrounding waves.
For example, if the main trend is bullish, the Motive wave will point “upward.” If the main trend is bearish, the Motive wave will point “downward.” In summary, the basic idea is acting in the same direction as the trend. A trend larger than one level usually occurs in 5 waves. Anti-trend reactions larger than one level usually occur in three waves.
What’s interesting about these waveforms is that they’re recurring. You find them everywhere in stock price charts, no matter what timeframe you’re looking in.
The big difference you’ll note is that some waves are larger than others. Elliott himself defined nine different magnitudes of waves, from tiny wiggles to gigantic, paradigm-shifting market movements. You can see Elliott’s nine levels defined below, in Figure 1.7.
Most analysts, however, only use three degrees of wave amplitude when conducting their analysis to determine price, direction and trend in a large, medium and small trends only the same as shown in the example in figure 1.6.
For the most part, what defines a wave as being one degree or another is the overall pattern of the wave set and the relationship between price and time. Time, however, tends to be the lesser factor. Consider the two waves shown below. The first is two units high (price) and two units wide (time). The second is two units high (price) and ten units wide (time). These are considered to be the same degree.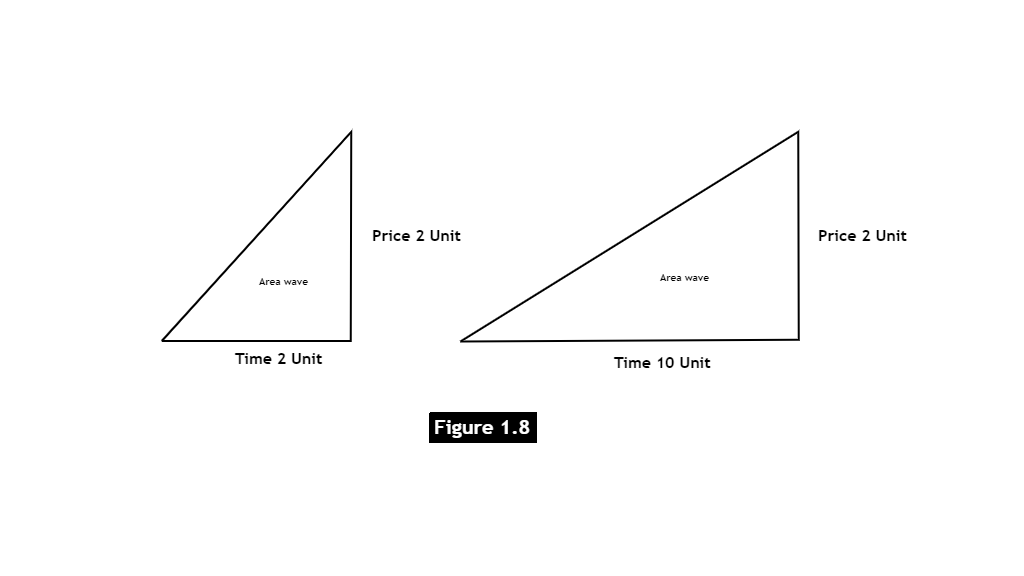
Although they are the same height (price), they are not the same type of market or trend. This can be seen from the time ratio.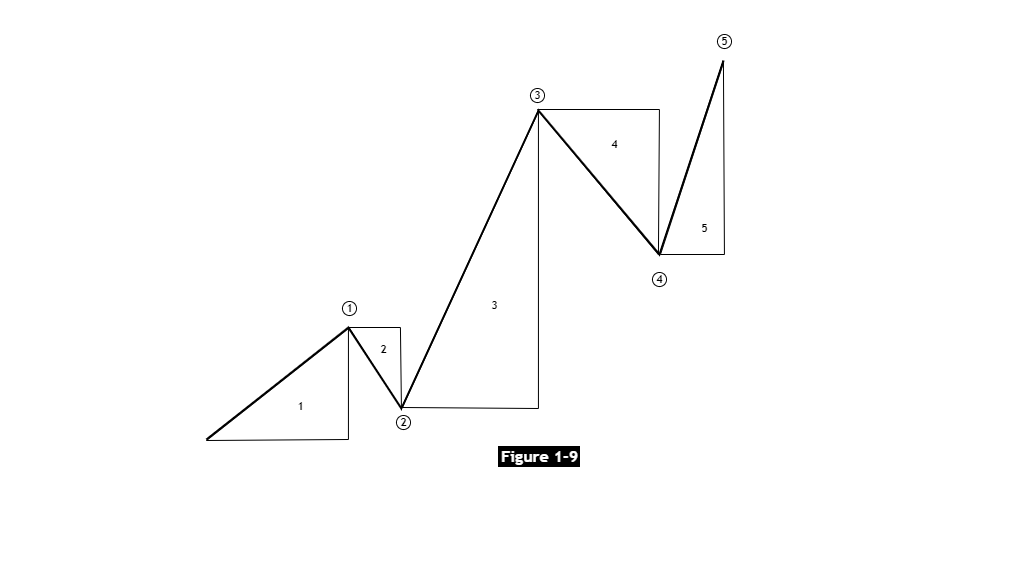
Contrast the first example with this one. Clearly, wave three represents something altogether different in the set of waves shows in figure 1.9. These two examples tell remarkably different stories, both of which rely on the interplay between price, time and the wave’s relationship to those that surround it.
Analyzing these waveforms and drawing useful inferences from them takes both practice and experience.
In a nutshell, degree wave is the identification of the price structure of which part of the wave is at a larger scale with what sub-level Wave levels do not depend on the size of a specific price or timeframe. Rather it is determined by the price pattern and surrounding wave set.
During his research, Elliott defined a total of thirteen different wave structures. We’ll present these below in the form of a quick overview. First, here are the structures in graphical form: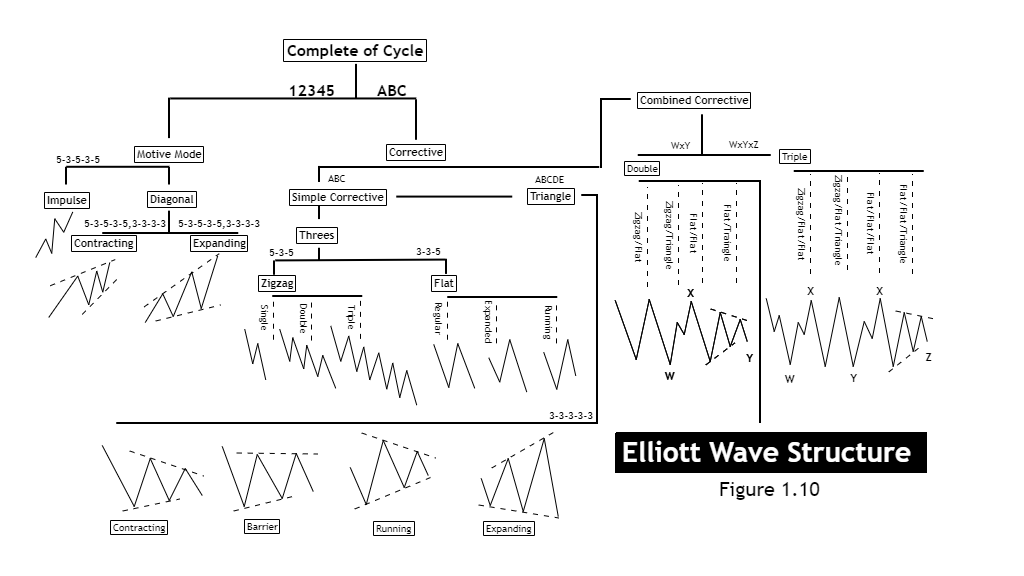
And here they are in a slightly different form:
First, it’s important to remember a point that we made early on. There are two wave modes: Motive (5) and Corrective (3).
Motive waves are patterns of five ways which consists of:
- Impulse
- Diagonal, Ending
- Diagonal, Leading
Corrective waves are divided into two types:
Simple and Combined.
Simple Corrective waves can be further divided into:
- Zigzag
- Single
- Double Zigzag*
- Triple Zigzag*
- Flat
- Triangle
- Contracting
- Barrier
- Expanding
- Running
Combined Corrective Waves can be subdivided into the following categories:
- Double Corrective
- Zigzag/Flat
- Zigzag/Triangle
- Flat/Flat
- Flat/Triangle
- Triple Corrective
- Zigzag/Flat/Flat
- Zigzag/Flat/Triangle
- Flat/Flat/Flat
- Flat/Flat/Triangle
- Most compound waveforms tend to be sideways-moving and have complex structures. Double and Triple Zigzag waveforms, differ markedly, as they present at sharp angles from the preceding Motive wave, and thus, are easy to notice. Therefore, these are not included in the mixed waveform, but as part of the Combine Corrective pattern.
A Motive wave is a wave that moves in the same direction as a trend that is one degree larger than itself, and travels with a steep degree. Motive waves are identified by specific rules called “the rule of infrastructure.”
Note that the rules governing Motive Wave formation and structure cannot be violated. If they are violated then the analyst is definitionally incorrect. Here are the rules:
Motive Waves…
1) Can be subdivided into five waves
2) Move in the same direction as a trend that is one level (degree) larger than itself
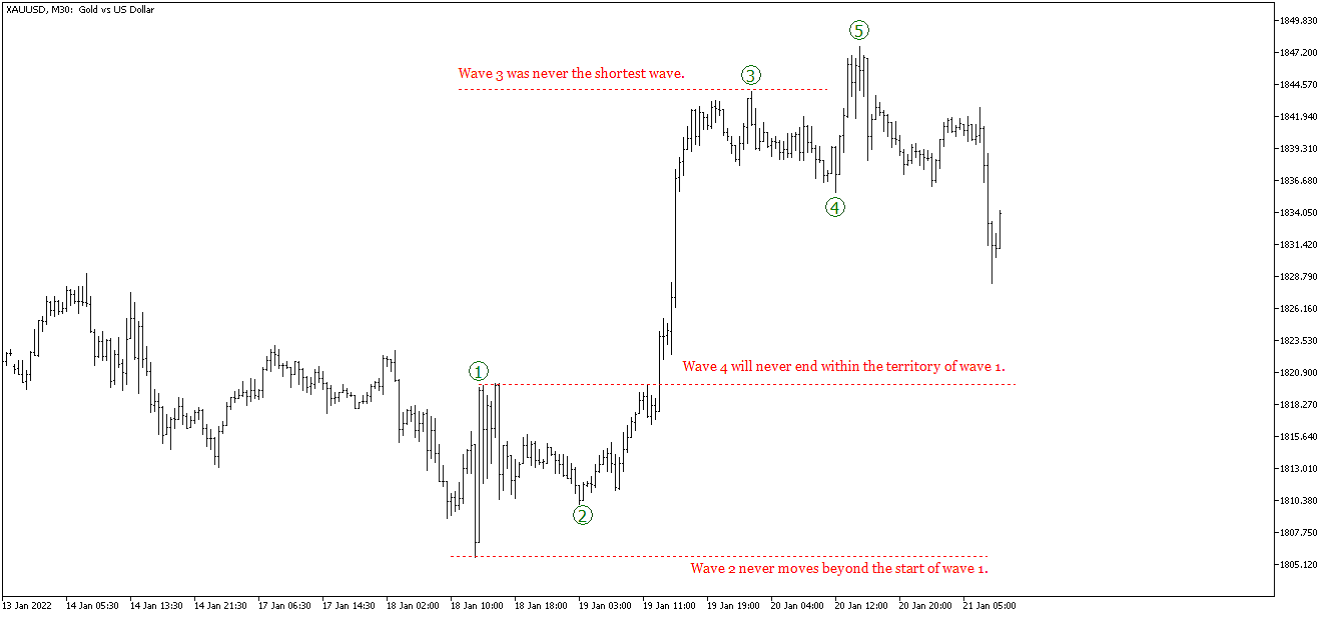
3) Wave 2 does not reverse beyond the beginning of Wave 1
4) Wave 4 does not reverse beyond the beginning of Wave 3
5) Wave 3 must have an endpoint beyond the end of Wave 1.
6) When comparing Waves 1,3, and 5, Wave 3 must not be the shortest wave.
Motive waves can be of two types: Impulse and Diagonal.
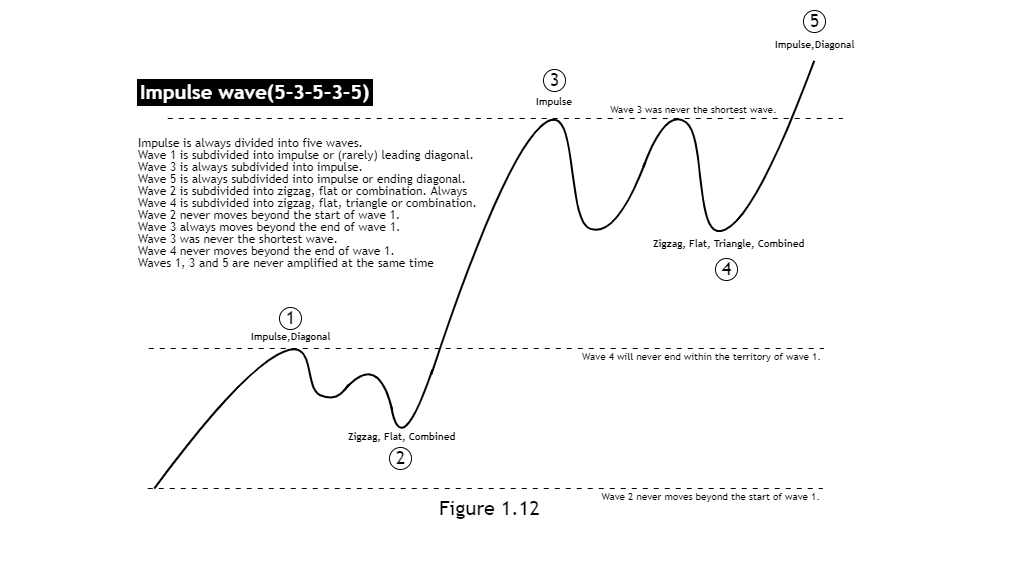
Impulse Waves are the most common Motive waves. One distinctive feature of Impulse waves is the fact that Wave 4 does not enter the territory of Wave 1, indicating the strength of the trend. Additionally, Wave 3 must always be an Impulse Wave. The structure rules of an Impulse wave are as follows:
- An Impulse Wave is always divided into five waves
- Wave 1 is almost always defined as an Impulse Wave but can occasionally be described as a Leading Diagonal
- Wave 3 is always some variant of an Impulse Wave
- Wave 5 is almost always defined as an Impulse Wave but can occasionally be described as an Ending Diagonal
- Wave 2 can be described as a Zigzag, flat or Combination wave. **
- Wave 4 can be described as a zigzag, flat, triangle or combination. **
- Wave 2 never moves beyond the start of Wave 1.
- Wave 3 always moves beyond the end of Wave 1.
- Wave 3 will never be the shortest wave
- Wave 4 never moves beyond the end of Wave 1.
- Waves 1, 3, and 5 are never “Extensions” at the same time *.
Notes:
* See the content on “Extensions”
** See the content on “Corrective Waves”
- Wave 4 is almost always of a different correction pattern than wave 2.
- Wave 2 is usually a zigzag or zigzag combination.
- Wave 4 is usually a flat, triangle, or flat combination.
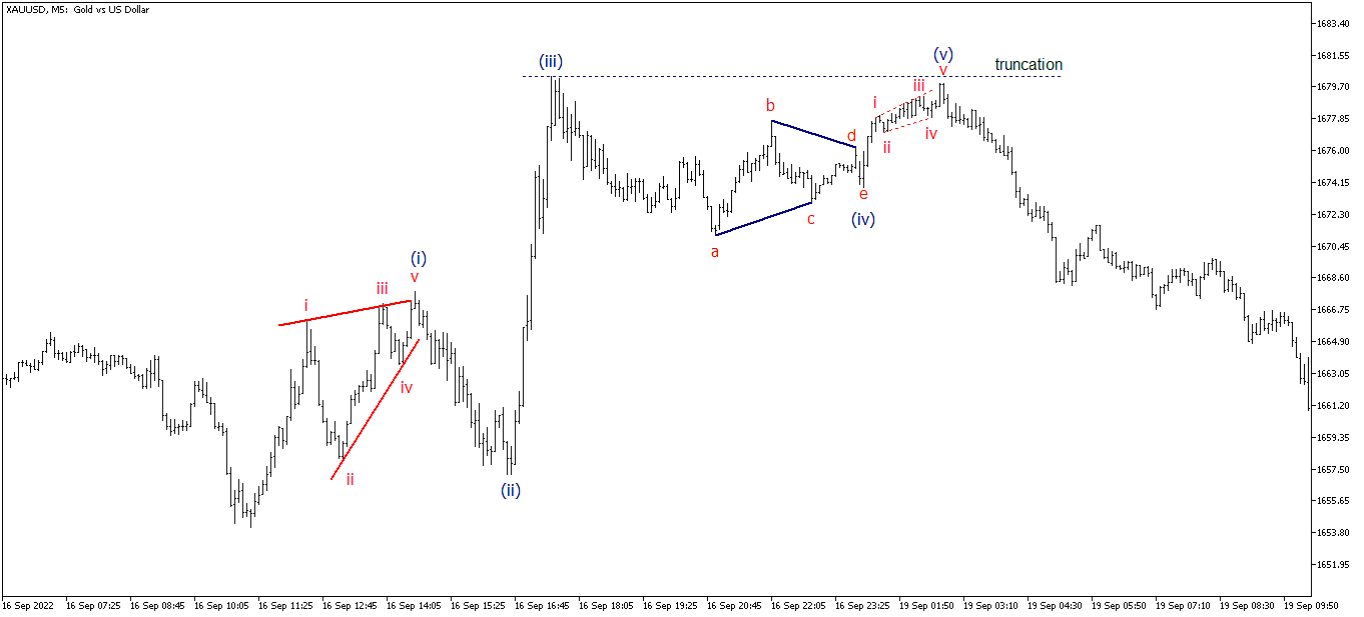
- Sometimes wave 5 will not travel beyond the end of wave 3, in which case it is called truncation.
- Wave 5 usually ends when it meets or slightly exceeds the line drawn from the tip of wave 3, which is slightly parallel to the line connecting the ends of wave 2 and 4.
- The center of wave 3 usually has the steepest slope of equal time intervals within the main impulse. Except that sometimes the beginning of wave 1 ("start") is steeper.
- Waves 1, 3, or 5 are usually extensions. (The extension may appear "stretched" because the correction wave is small compared to the impulse wave. They can be significantly longer and have larger subdivisions than non-extension waves).
- Often the extension sub-wave is the same number (1, 3, or 5). For example, if wave 3 is an extension, if there is more internal extension, it is usually the third sub-wave of wave 3.
- It is not often that two sub-waves are extensions. Although it is normal for both waves 3 and 5 to expand when the sub-wave is the Cycle level or the Supercycle level and within the fifth wave above one degree.
- Wave 1 is the wave with the least chance of extension.
- When wave 3 is an extension, waves 1 and 5 are usually equal or Fibonacci ratios.
- When wave 5 is extension, it is usually Fibonacci proportional to the net travel of wave 1 to 3.
- When wave 1 is extension, it is usually in Fibonacci proportion to the net travel of wave 3 to 5.
- Wave 4 generally ends when it is within Wave 3's sub-wave iv price range.
- Wave 4 usually divides the entire impulse into Fibonacci proportions in time and price.
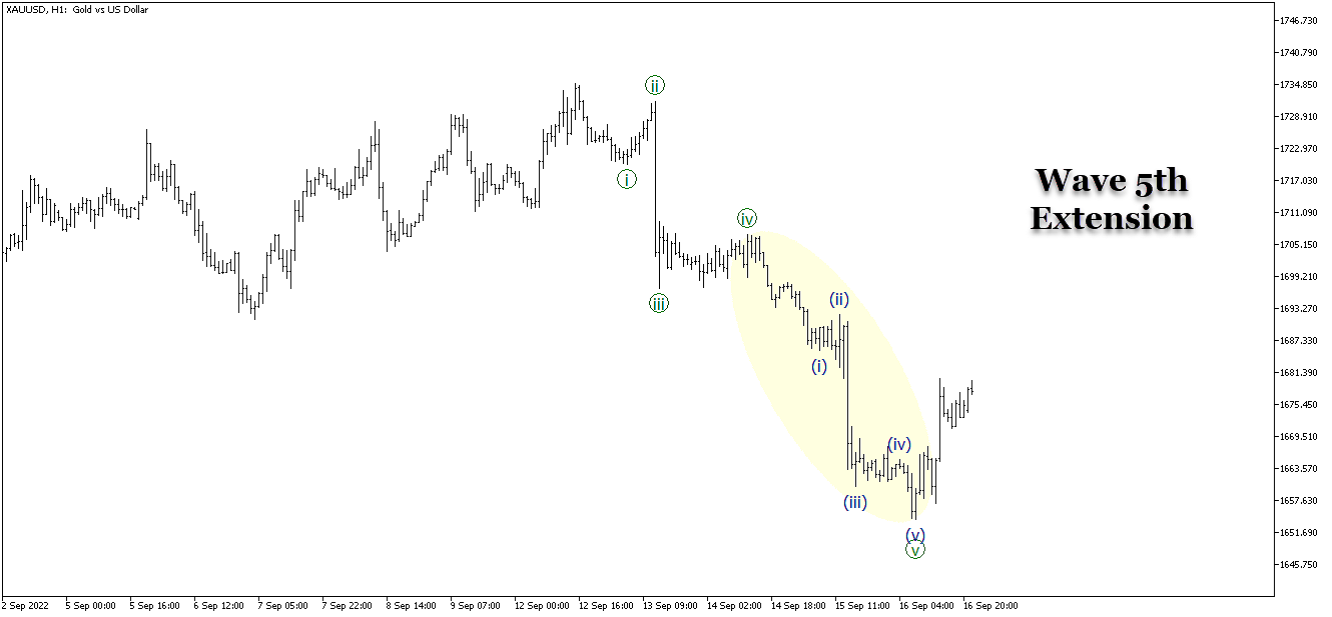
Most Impulse Waves are Extensions, which are waves that are “stretched” by the price ration. Here are some examples (one example in each position (1,3,5):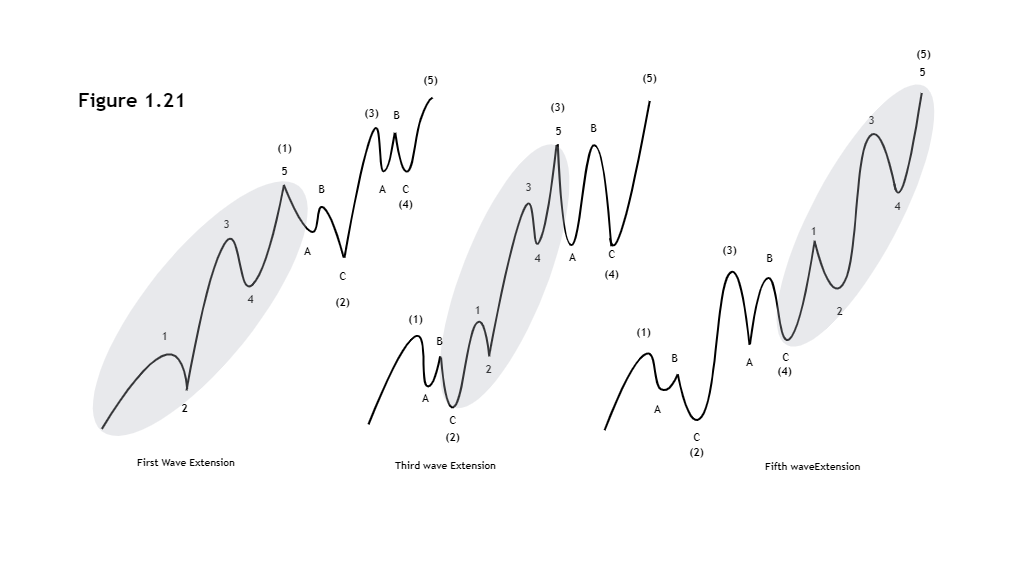
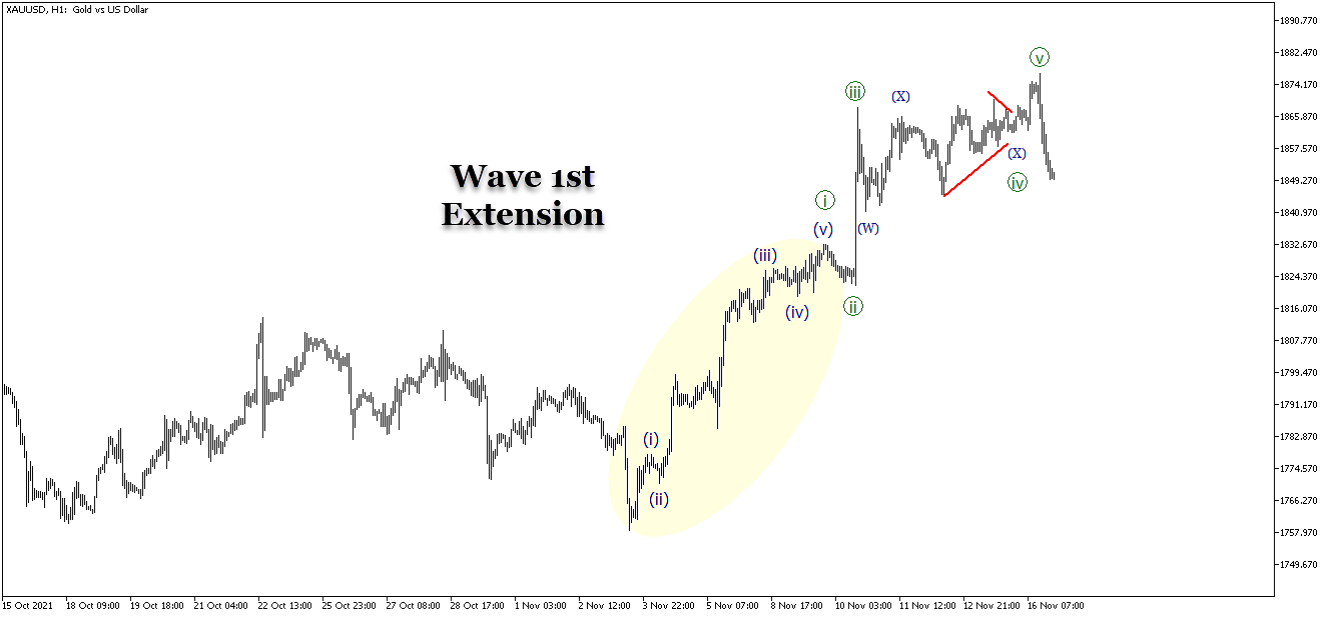
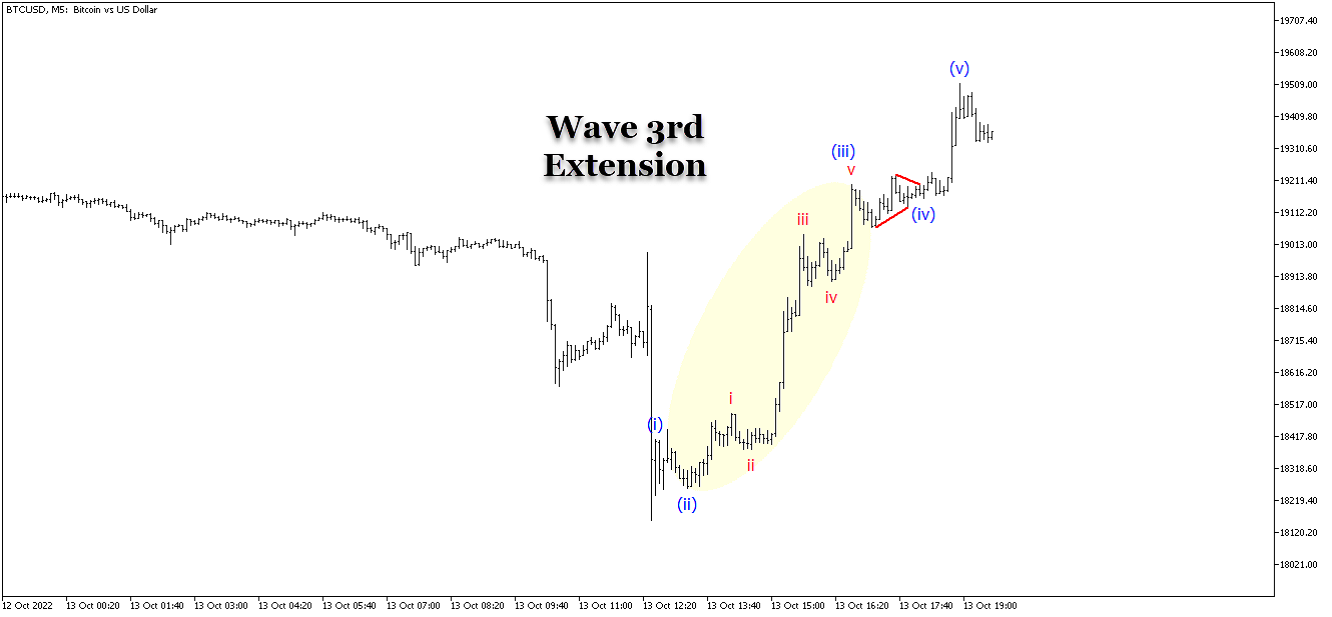
Oftentimes, the Extension sub-wave is the same number (1,3, or 5). For example, if Wave 3 is an extension, and if there’s further internal extension, it will generally be found on the third sub-wave of Wave 3, creating an easily identified pattern.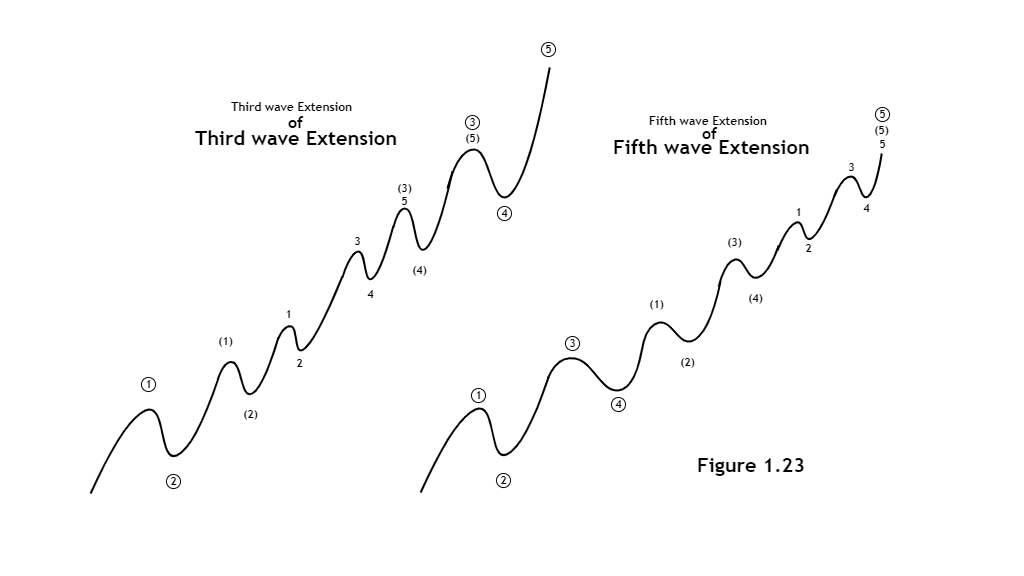
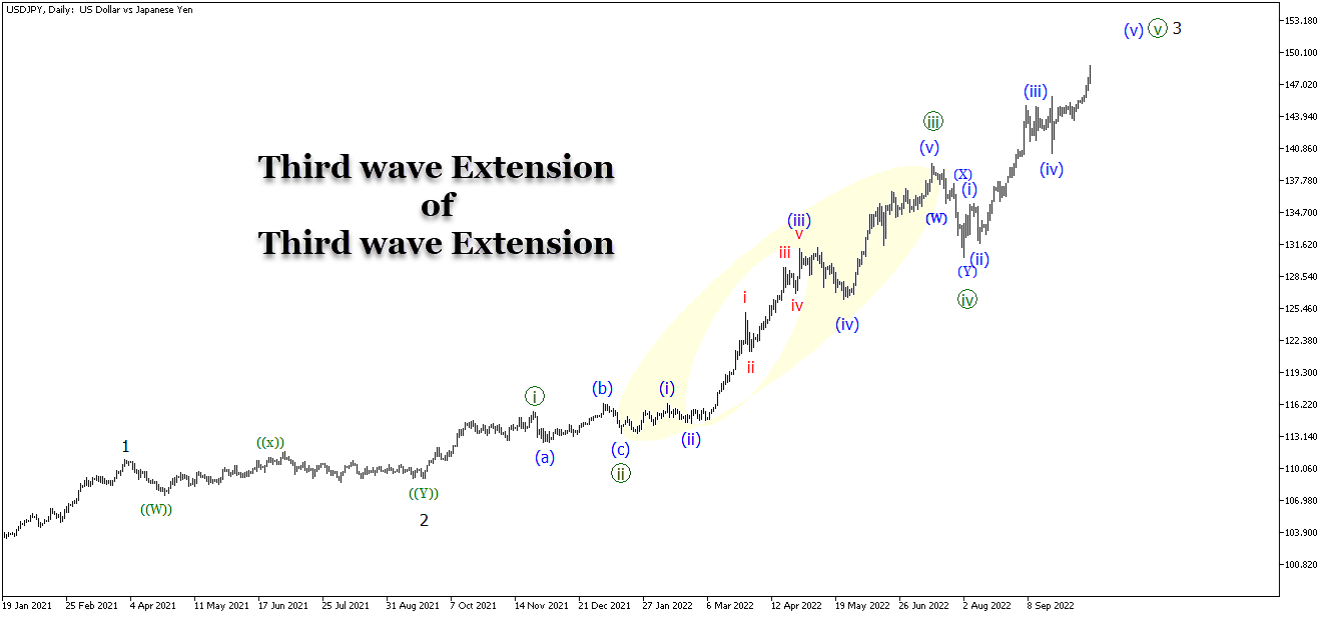
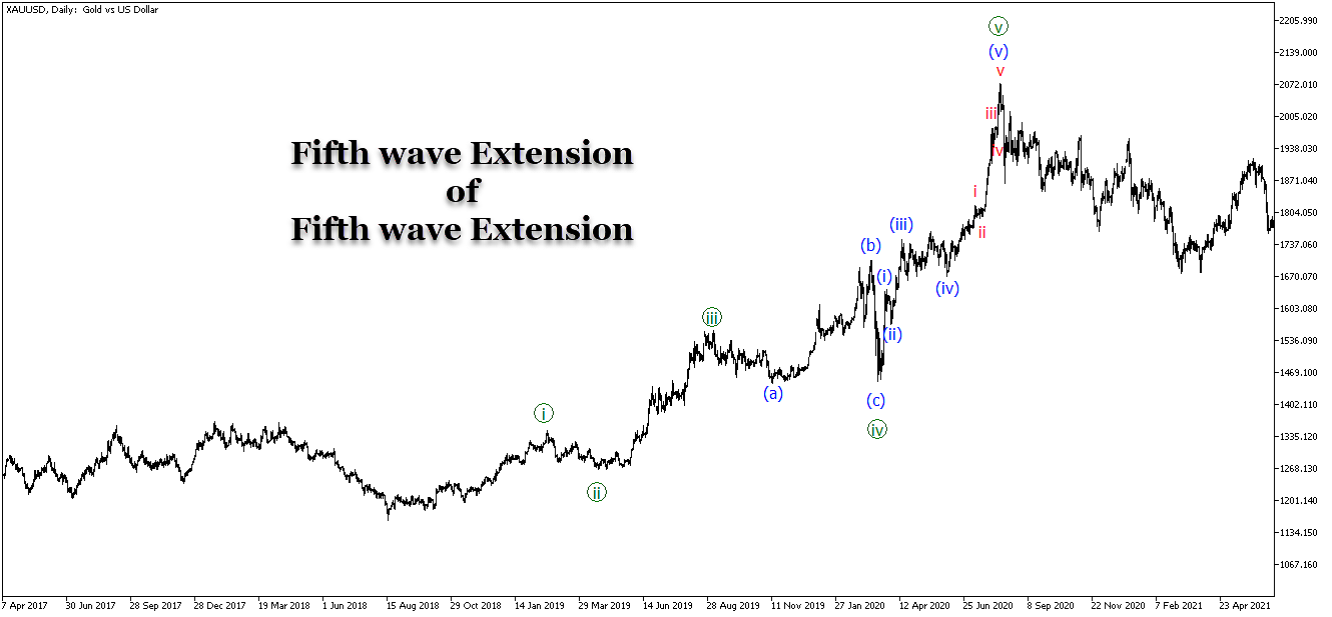
Most of the Extension waves occur only in one of the Impulse Waves, but in rare cases, the Extension takes place twice between the Third and Fifth Waves.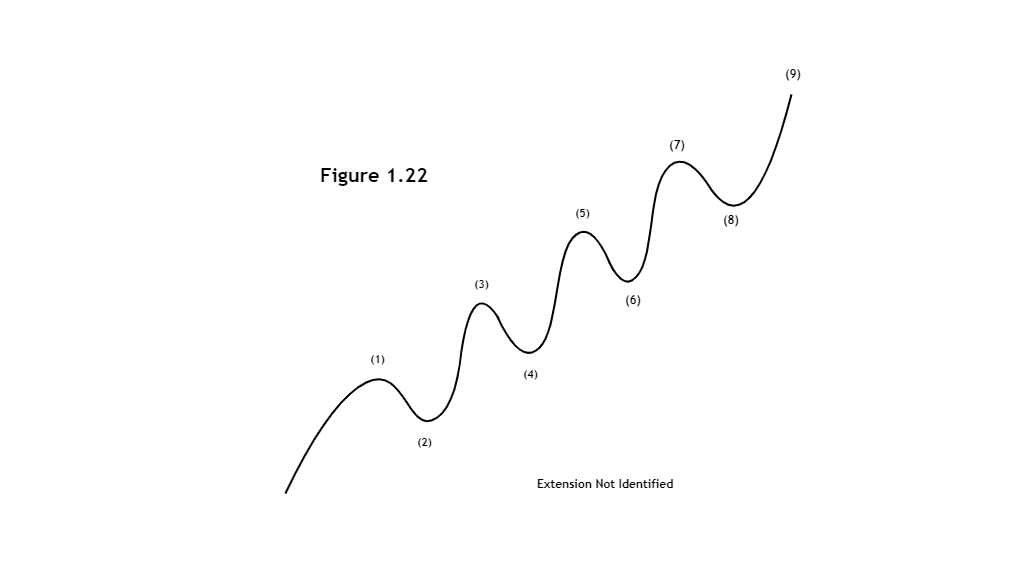
In some cases, the extension of the wave cannot be determined because the extension wave has almost the same price amplitude and duration. In such cases, even where a clear determination cannot be made, an analyst can still count these examples as containing all nine waves without breaking the rules, even though the break points cannot be clearly defined.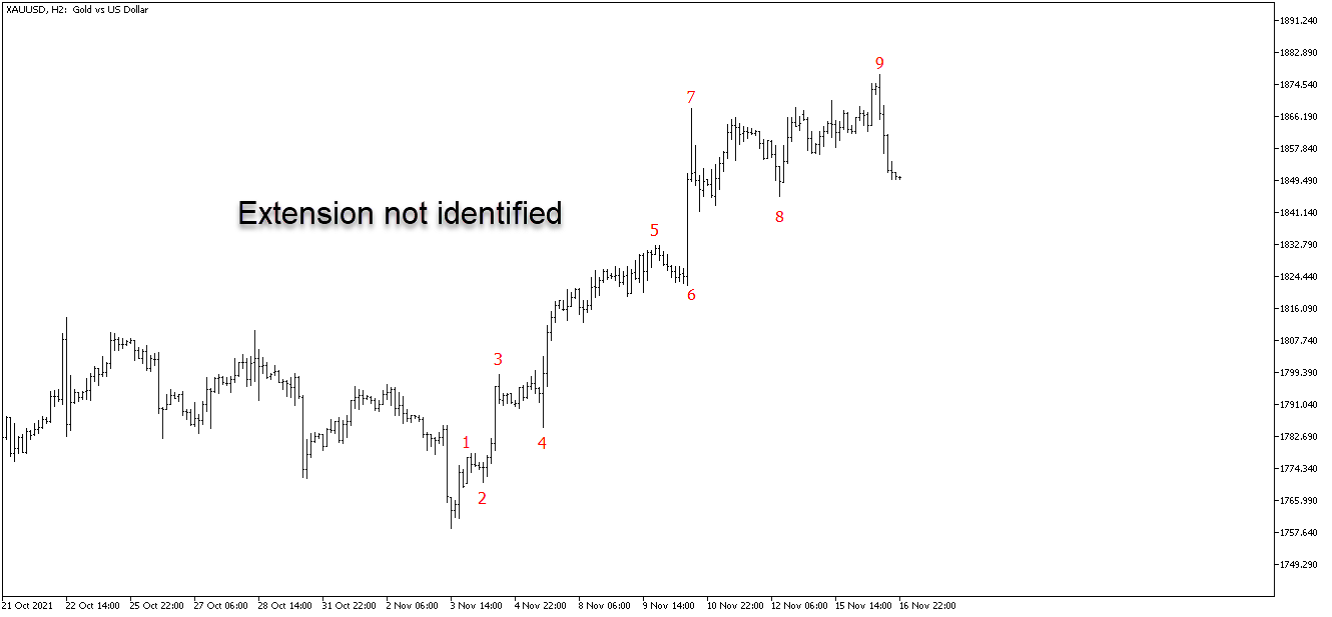
Elliott describes a situation where the fifth wave cannot go beyond the end of the third wave as a “fail” or Truncation. This occurs when the third wave has a long and intense adaptation and the fourth wave is quite steep, which makes it virtually impossible for the fifth wave to rise above the peak of the third wave.
This scenario is quite rare and analysists will seldom see it. It does happen, however, and that makes it worth drawing your attention to.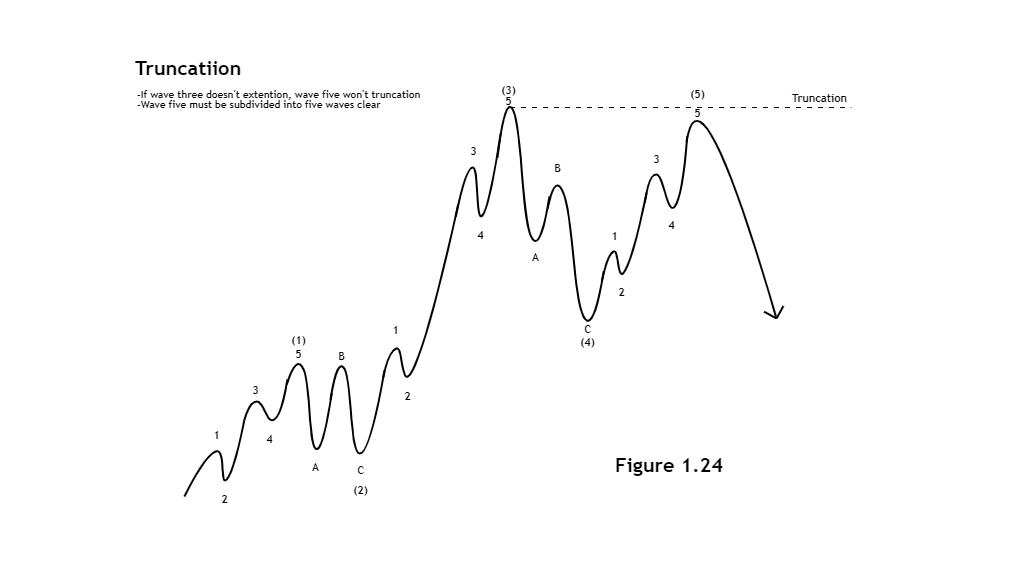
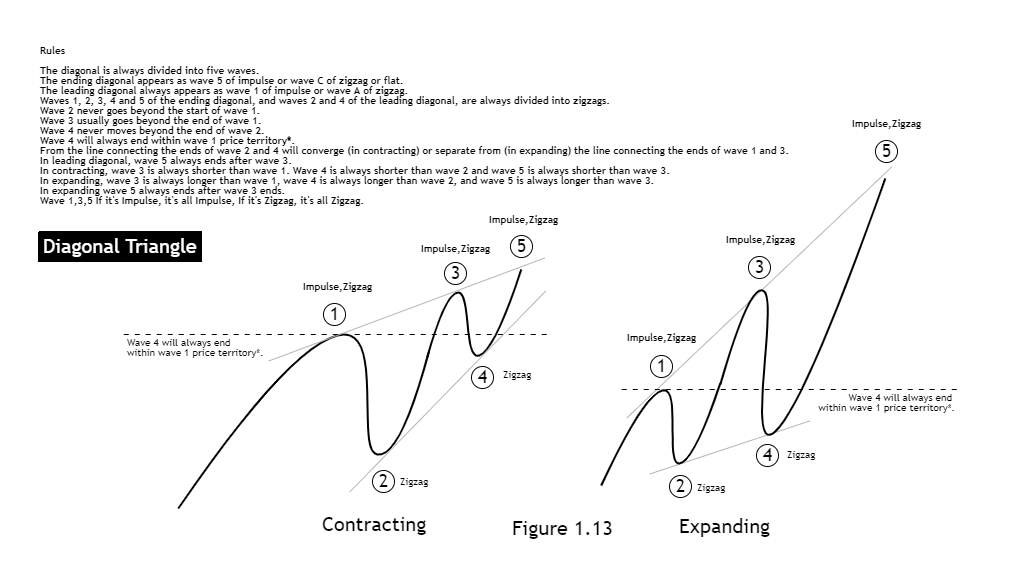
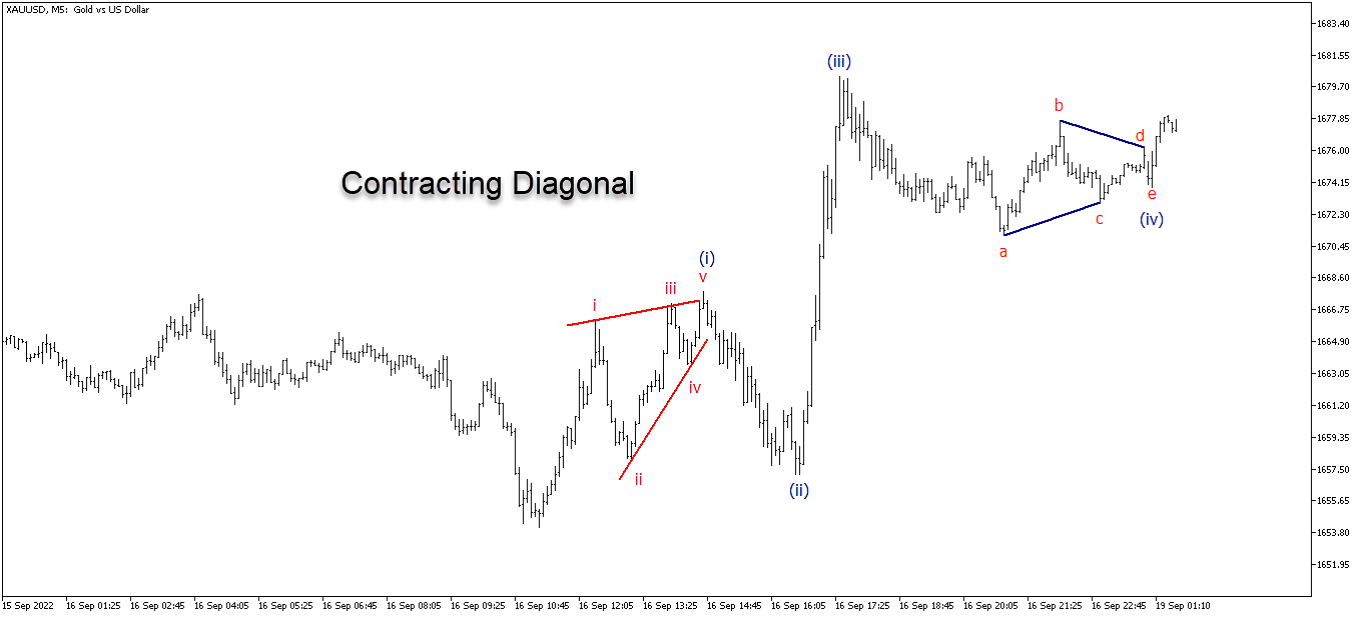
The Diagonal Triangle is considered to be one of the motive waves but is not an impulse wave because the fourth wave of the diagonal has an end within the first wave. It usually occurs either at the beginning of a big trend and towards the end of the trend. It can also occur in the A of the Zigzag and the C of the corrective wave.
There are two types of diagonal triangles based on the wave's apparent position: Leading Diagonal and Ending Diagonal.
● The diagonal is always divided into five waves.
● The ending diagonal appears as wave 5 of impulse or wave C of zigzag or flat.
● The leading diagonal always appears as wave 1 of impulse or wave A of the zigzag.
● Waves 1, 2, 3, 4 and 5 of the ending diagonal, and waves 2 and 4 of the leading diagonal, are always divided into zigzags.
● Wave 2 never goes beyond the start of wave 1.
● Wave 3 usually goes beyond the end of wave 1.
● Wave 4 never moves beyond the end of wave 2.
● Wave 4 will always end within wave 1 price territory*.
● The line connecting the ends of wave 2 and 4 will converge (in contracting) or separate from (in expanding) the line connecting the ends of wave 1 and 3.
● In the leading diagonal, wave 5 always ends after wave 3.
● In contracting, wave 3 is always shorter than wave 1. Wave 4 is always shorter than wave 2 and wave 5 is always shorter than wave 3.
● In expanding, wave 3 is always longer than wave 1, wave 4 is always longer than wave 2, and wave 5 is always longer than wave 3.
● In expanding wave 5 always ends after wave 3 ends.
● Waves 2 and 4 each tend to reverse .618 to .786 of the previous wave.
● Waves 1, 3, and 5 of the leading diagonal are usually divided into zigzags. But sometimes it seems to be impulses.
● Within an impulse, if wave 1 is diagonal, wave 3 tends to amplify it.
● Within the impulse, wave 5 is unlikely to be diagonal if wave 3 is not amplified.
● In contracting, wave 5 usually ends after the end of wave 3 (a failure to do so is called truncation).
● In contracting, wave 5 usually ends at or slightly beyond the line connecting the ends of wave 1 and 3 (ending above the line is called a throw-over).
● In expanding, wave 5 usually ends slightly before the line connecting the ends of waves 1 and 3.

Corrective waves are waves that move opposite the main trend. The consequence of the previous Motive wave is the conflict with the trend. The fact that corrective waves exist is the reason that price charts look chaotic, with complex movements within any given frame of time.
Corrective waves take two basic forms: Simple or Combined.
Among Simple Corrective Waves, we again find two types – Shape and Sideways.
Shape Corrective Waves move opposite the trend with a steeply sloping degree, creating a ZigZag shape.
Sideways Corrective Waves expand the structure of the larger waveform to the size and manifest in forms like flats and triangles.
Where Combined Corrective Waves are concerned, we also find two types: The Double Corrective and the Triple Corrective. The way to differentiate between Motive wave and Corrective wave again by counting sub-waves and remembering that only Motive Waves have five components. Corrective Waves do not.
This can get almost frighteningly complex, and many Elliott Wave analysts struggle to determine when a corrective wave will end until they have moved well beyond the pattern.
There are three types of Zigzags you’ll see: A Single Zigzag, a Double Zigzag, or a Triple Zigzag.
A single zigzag is a three-wave reduction with an internal sub-wave sequence of 5-3-5 and wave B clearly below the beginning of wave A. In some cases, a zigzag may occur twice or up to three times in a row. To achieve this significant goal, each Zigzag is sandwiched between a three-wave pattern (Corrective wave), creating a Double or Triple Zigzag, where Zigzag is more likely to occur in the second wave of the motive wave than the fourth wave. and is in the sub-wave of the triangle and the X wave in the compound wave set.
● The zigzag is always divided into three waves.
● Wave A is subdivided into impulse or leading diagonal.
● Wave C is subdivided by impulse or ending diagonal.
● Wave B is always subdivided into zigzag, flat, triangle or combination.
● Wave B never moves beyond the beginning of wave A.
● Wave A is subdivided into impulse. almost every time
● Wave C is always subdivided into impulse.
● Wave C is usually the same length as wave A.
● Wave C usually ends beyond the end of wave A.
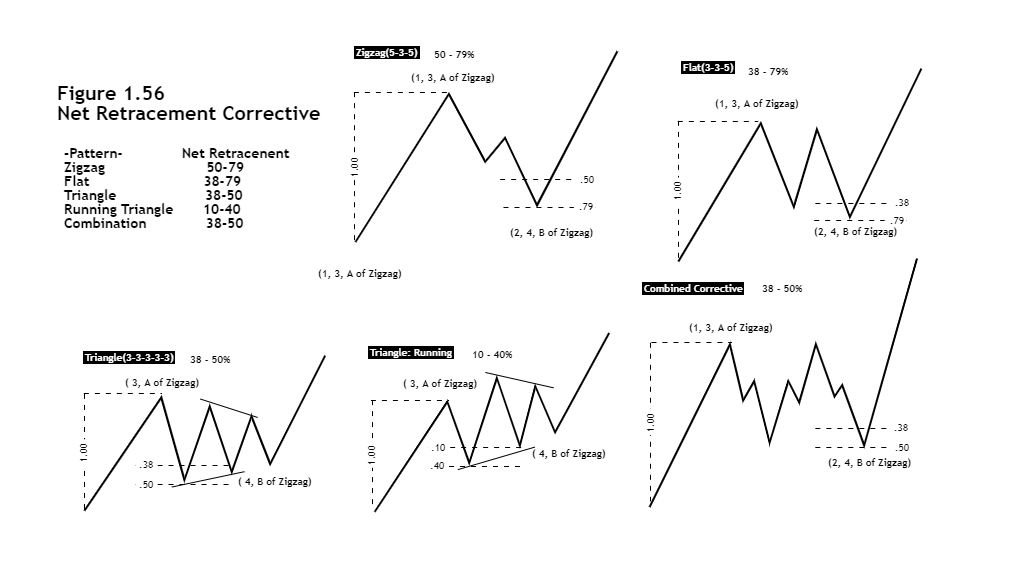
● Wave B usually reverses 38 to 79 percent of wave A.
● If wave B is the running triangle, it typically reverses between 10 and 40 percent of wave A.
● If wave B is a zigzag wave Typically reverses 50 to 79 percent of wave A.
● If wave B is a triangle, it typically reverses 38 to 50 percent of wave A.
● The line connecting the ends of wave A and C is usually parallel to the line connecting the tip of wave B to the beginning of wave A (predicted, wave C usually ends when it reaches a line drawn from end wave A, i.e., parallel to the connecting line. start of wave A and end of wave B).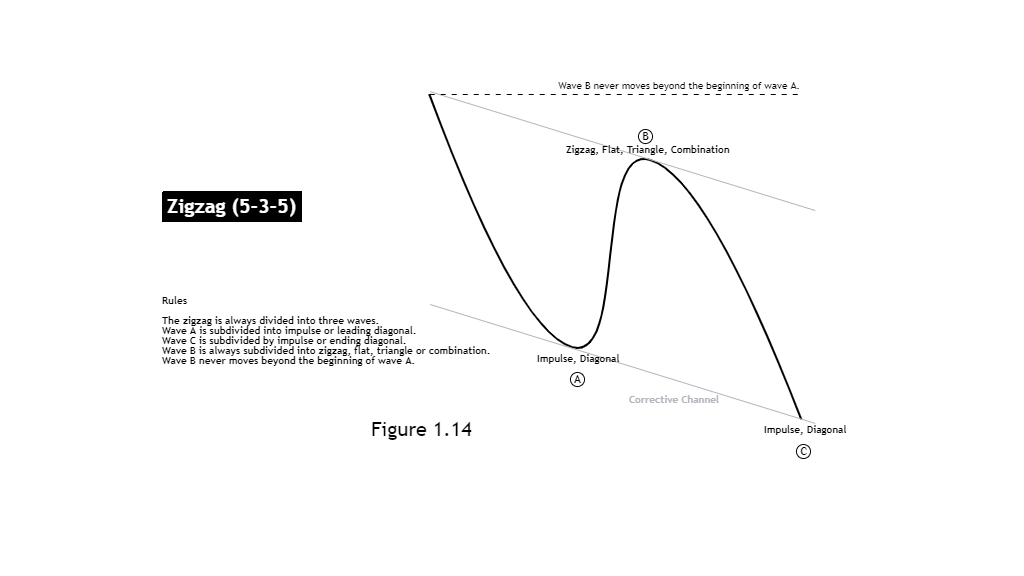
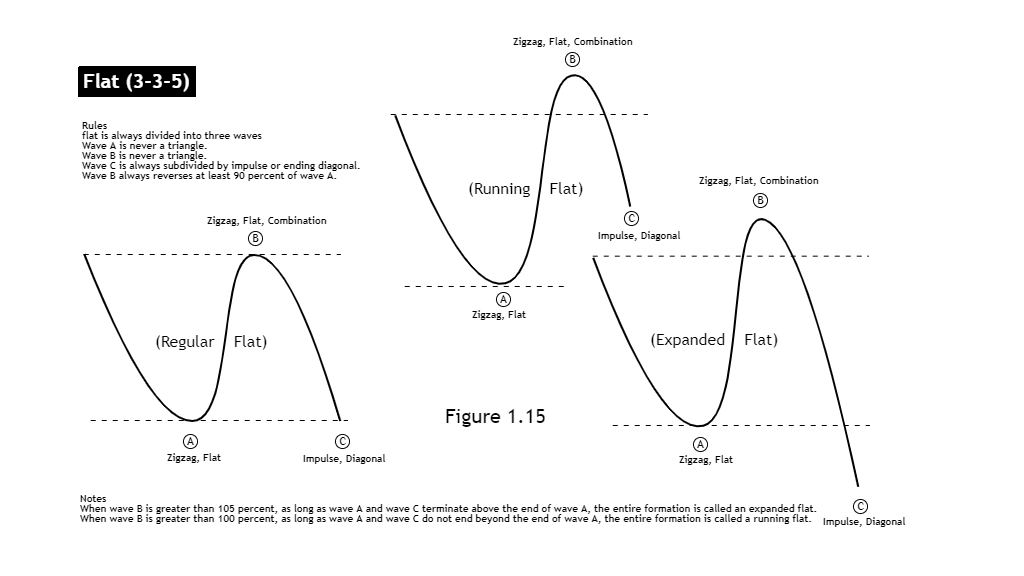
This is a simple corrective wave pattern where Wave A has only three amplified waves. Because of its lack of pressure, wave B can travel up to or beyond the beginning of wave A, with wave C extending by five waves. Flat tends to produce less reversibility than Zigzag and is more likely to occur in wave four of Impulse Wave Definition of Flat is any corrective wave A-B-C that can be subdivided into 3-3-5.
● The Flat is always divided into three waves.
● Wave A is never a triangle.
● Wave B is never a triangle.
● Wave C is always subdivided by impulse or ending diagonal.
● Wave B always reverses at least 90 percent of wave A.
● Wave B usually reverses between 100 and 138 percent of wave A.
● Wave C is usually between 100 and 165% of wave A.
● Wave C usually ends beyond the end of wave A.
● When wave B is greater than 105 percent, as long as wave A and wave C terminate above the end of wave A, the entire formation is called an expanded flat.
● When wave B is greater than 100 percent, as long as wave A and wave C do not end beyond the end of wave A, the entire formation is called a running flat.
If you identify this pattern, it’s a reflection of the fact that there is a balance of buying and selling pressure. This causes the price to move sideways.
The Triangle pattern is made up of five overlapping waves, broken down into 3-3-3-3-3, labeled A-B-C-D-E in a Triangle pattern, often occurring with the fourth wave, in an impulse wave, or B in the corrective wave (ABC) and the last X in the combination wave.
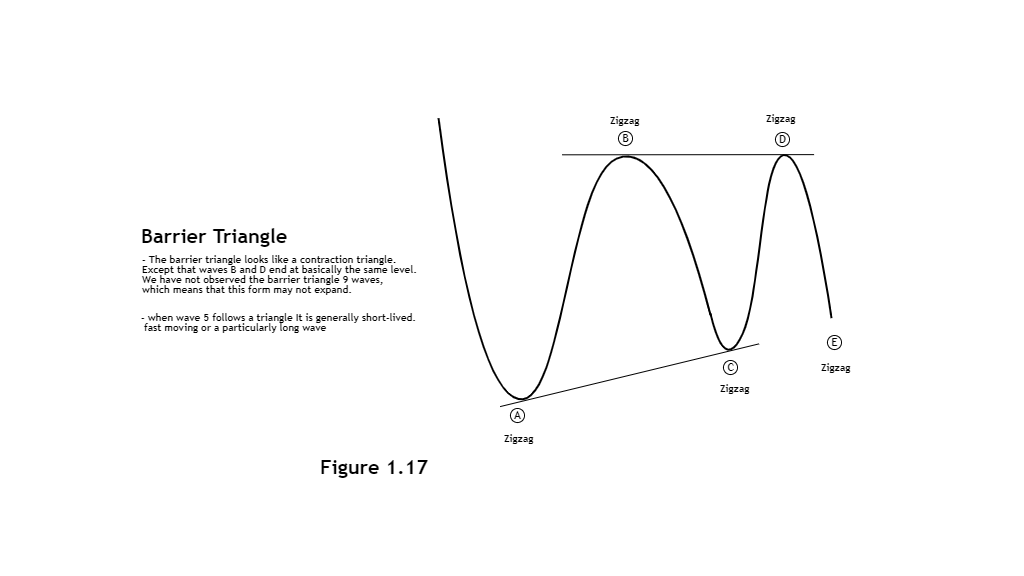
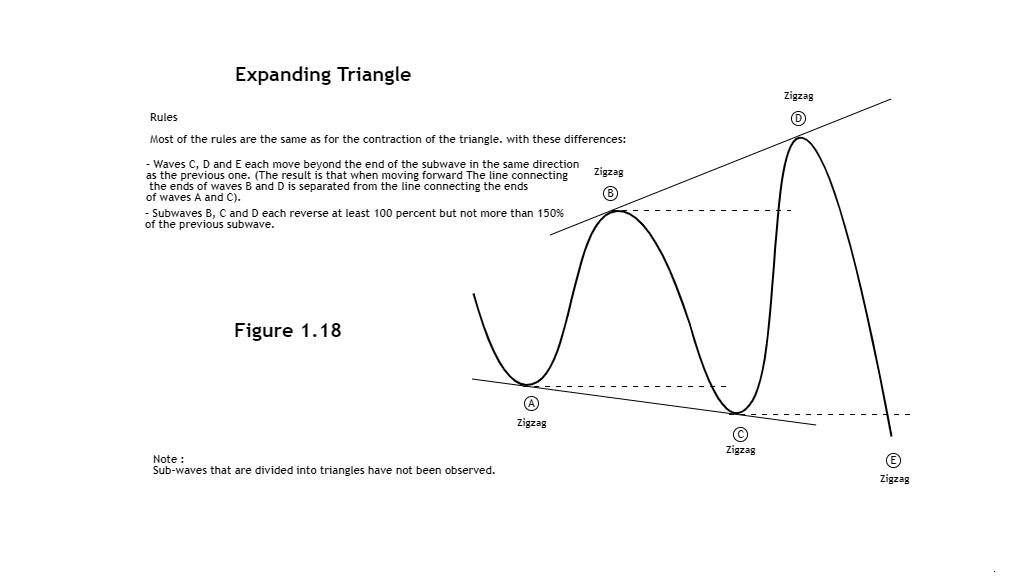
In the triangle pattern, there are four subsets according to their characteristics: the Contacting Triangle is a symmetrical triangle, the Barrier Triangle usually has an upper end point. The Running Triangle has wave B reversing more than the beginning of wave A, and the final form, the Expanded Triangle, is an inverted triangle. Triangles are defined by drawing a line connecting the A-C and B-D waves.
Triangles are always subdivided into five waves.
● At least four waves between waves A, B, C, D and E, each subdivided into a zigzag or zigzag combination.
● Wave C never travels beyond the end of wave A, wave D never travels beyond the end of wave B, and wave E never exceeds the end of wave C. The result is a sideways motion. The line connecting the ends of waves B and D converges with the line connecting the ends of waves A and C.
● A triangle never has more than one complex sub-wave, in which case it is always a zigzag combination or a triangle.
Wave C is usually subdivided into zigzag combinations that have a longer duration and a deeper percentage of reverse than each of the other sub-waves.
● Wave D is sometimes subdivided into zigzag combinations that have a longer duration and a deeper percentage of reverse than each other sub-wave.
● Sometimes one of the waves, usually waves C, D, or E, is divided into contraction or barrier triangles. Most of the time, the effect is as if all triangles consist of nine zigzags.
● Approximately 60 percent of the total wave B does not end beyond the beginning of wave A. At its end, the triangle is called the running triangle.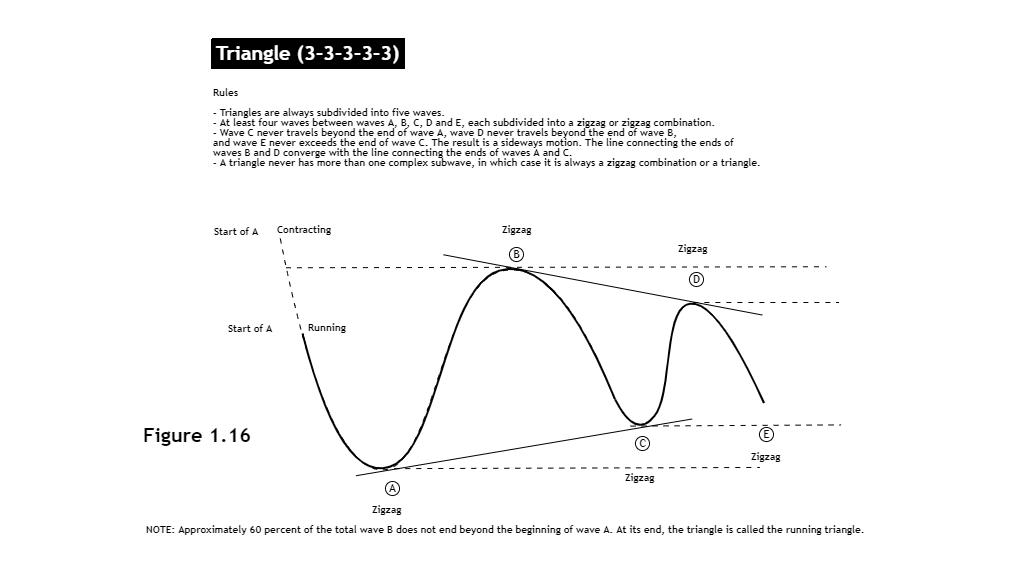
● The barrier triangle looks like a contraction triangle. Except that waves B
and D end at basically the same level. We have yet to observe the barrier
triangle 9 waves, which means that this form may not expand.
● when wave 5 follows a triangle It is generally short-lived. fast-moving or a
particularly long wave
This is a very rare triangular pattern that you won’t see very often. An Expanding Triangle is an inverted triangle that reflects tremendous price volatility. This pattern frequently ends with a strong, sudden pullback.
Most of the rules are the same as for the contraction of the triangle. with the following differences:
- Waves C, D, and E each travel beyond the end of the sub-wave in the same direction as the previous one. (The result is that when moving forward. The line connecting the ends of waves B and D is separated from the line connecting the ends of waves A and C).
- Subwaves B, C, and D each reverse at least 100 percent but not more than 150% of the previous sub-wave.
Most of the guidelines are the same. with the following points of differentiation:
- Sub-waves B, C, and D usually reverse 105 to 125 percent of the previous sub-wave.
- Sub-waves that are divided into triangles have not been observed.
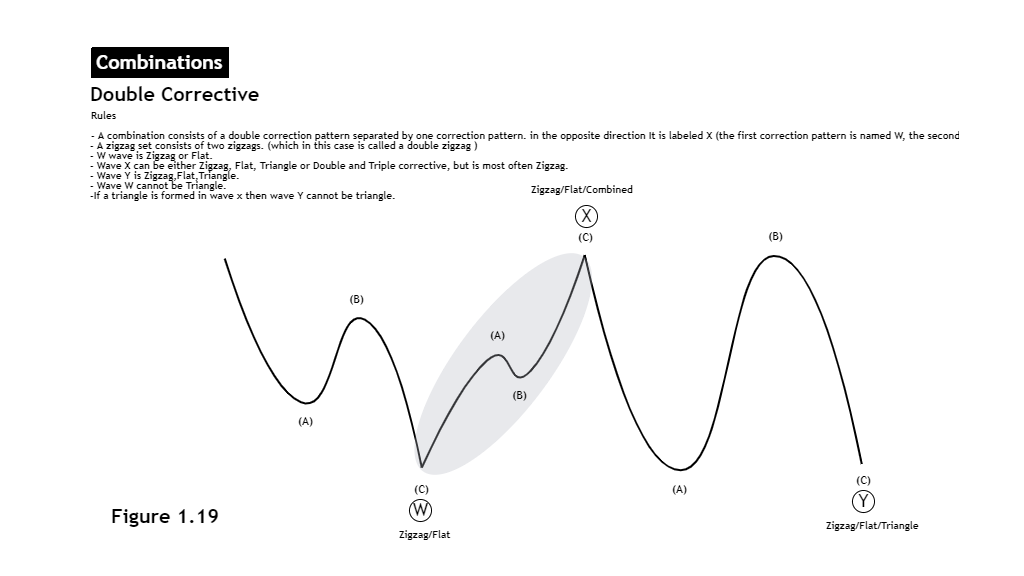
Elliott called this a "mixed outside correction", although sometimes it can be tilted up or down. Usually, it starts with a Zigzag or Flat pattern, but for Triangle, it is always the last wave series. With wave X sandwiched between the patterns. Mixed waves usually occur twice or up to three times. In these cases, we call it a “Double” or ”Triple Corrective.”
The combination is often formed when the first Corrective Wave does not develop sufficiently to achieve significant goals, resulting in a modified form.
The combination consists of two interpolation patterns separated by one interpolation pattern. In the opposite direction, it's labeled X (the first revision form is named W, second revision form is Y).
- A zigzag set consists of two zigzags. (which in this case is called double zigzag).
- The “W” wave is Zigzag or Flat, and cannot be triangular.
- Wave X can be either Zigzag, Flat, Triangle, or Double and Triple corrective, but most often it is Zigzag.
- Wave Y is a Zigzag, Flat, or a Triangle.
- If a triangular pattern occurs in wave x, wave Y cannot be a triangle.
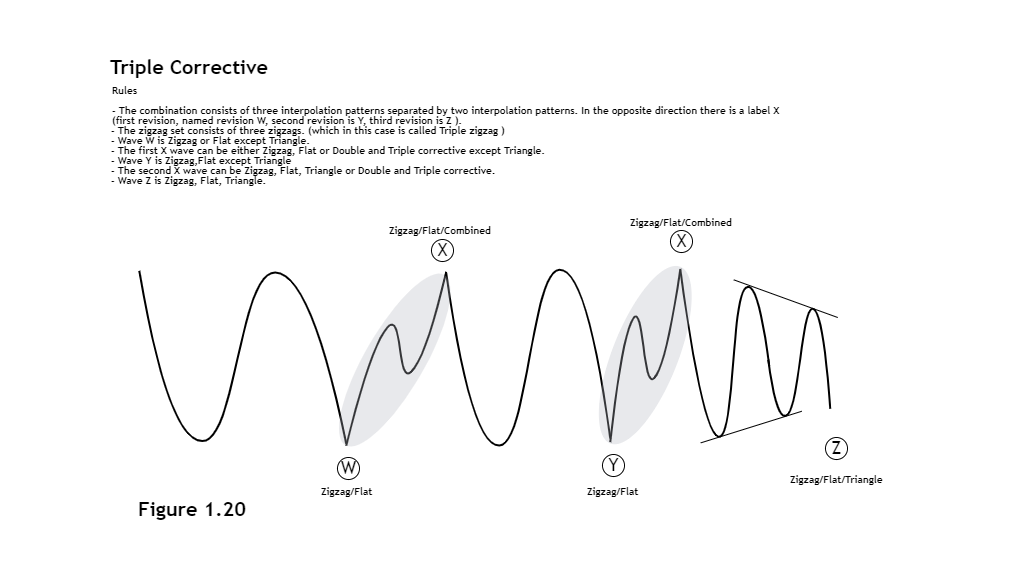
This combination consists of three interpolation patterns separated by two interpolation patterns that move in the opposite direction is labeled X, with the first revision form being labeled W, the second revision being labeled Y, and the third revision being labeled Z).
- Wave W takes the form of either a Zigzag, or Flat (but specifically not a Triangle).
- The first X wave can be either Zigzag, Flat, or Double/Triple corrective, but never a Triangle.
- Wave Y is Zigzag or Flat, but again, not a Triangle.
- The second X wave can be either Zigzag, Flat, Triangle, or Double and Triple corrective.
- Wave Z is Zigzag, Flat, or Triangle.
- If a triangle occurs in the second X wave then wave Z cannot be a triangle.
At the root, Alternation is about expecting differences to appear in the expression of similar waves. These differences can occur at ANY point, and in any type of wave (Motive or Corrective), and can take a variety of forms.
The alternation of wave 2 and 4 is both an alternation of price patterns and an alternation of motion characteristics. For example, if wave 2 is a deep adaptation (sharp) at a clear angle to wave 1, wave 4 is a sideways move.
Conversely, if wave 2 is an outward move sideways, wave 4 is a sharp adjustment at an angle to wave 3.
Alternating patterns are also common. If wave 2 is Zigzag, forecast a Flat or Triangle adjustment in wave 4. If wave 2 is flat, then forecast a Zigzag pattern in wave 4, etc.
*** Note, however, that alternation in a Diagonal Triangle pattern does not occur as wave 2 and wave 4 are usually Zigzag where the alternation appears in length. For example wave 1 is longer than wave 3, and wave 3 is longer than wave. 5 instead.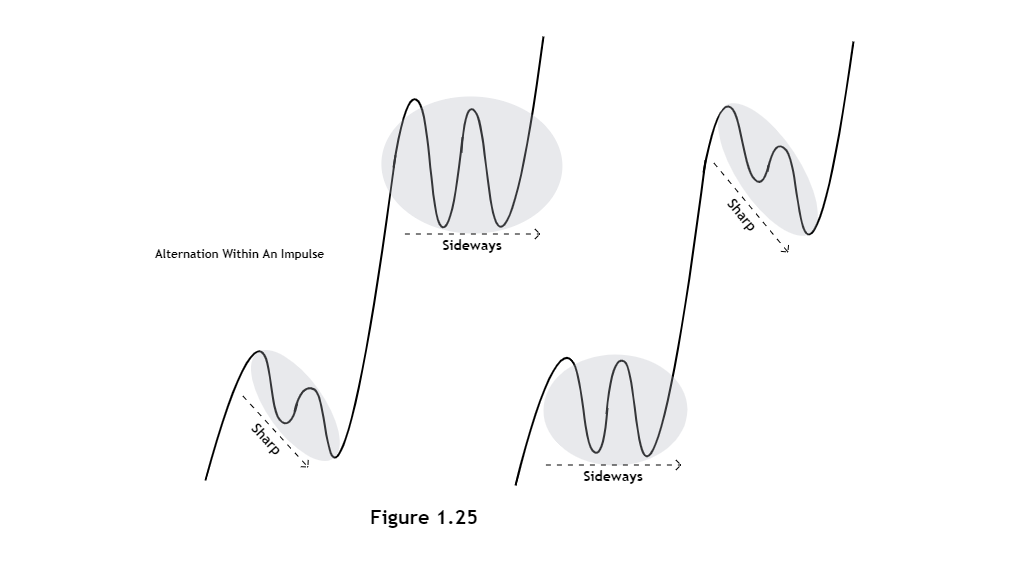
If Wave A in Corrective Wave is Flat, then predict wave B as Zigzag and vice versa.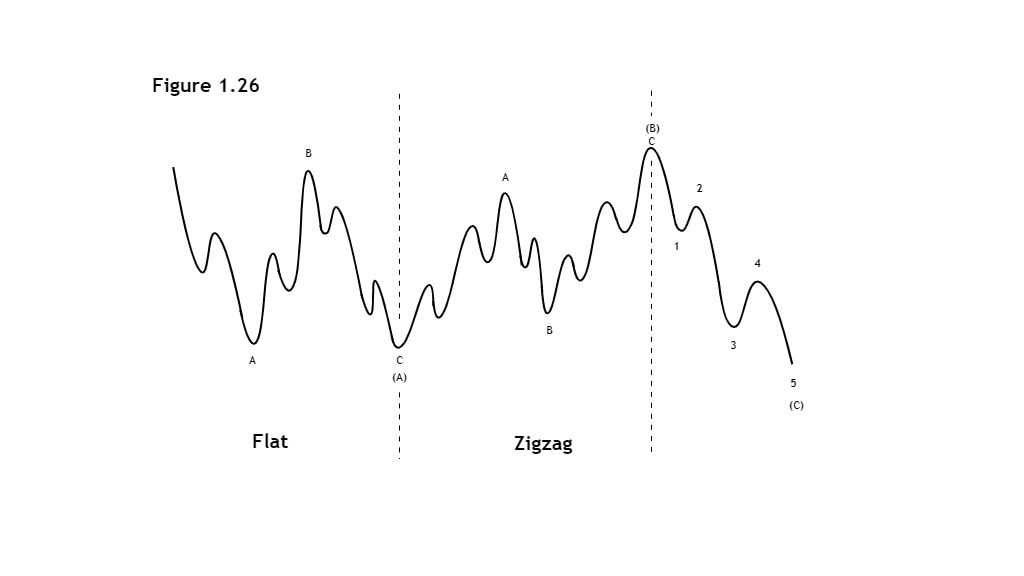

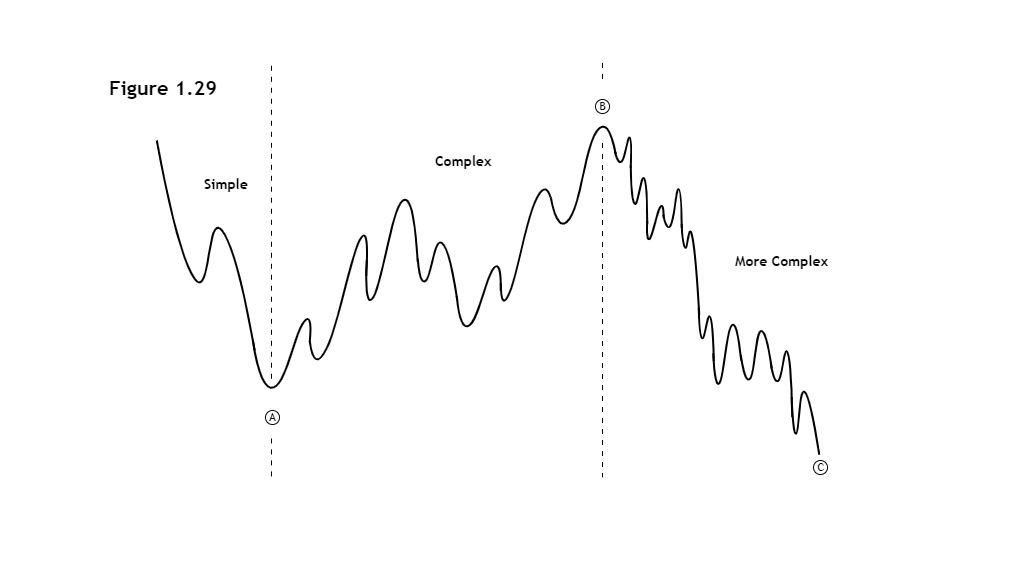
In addition, corrective waves appear to alternate in complexity.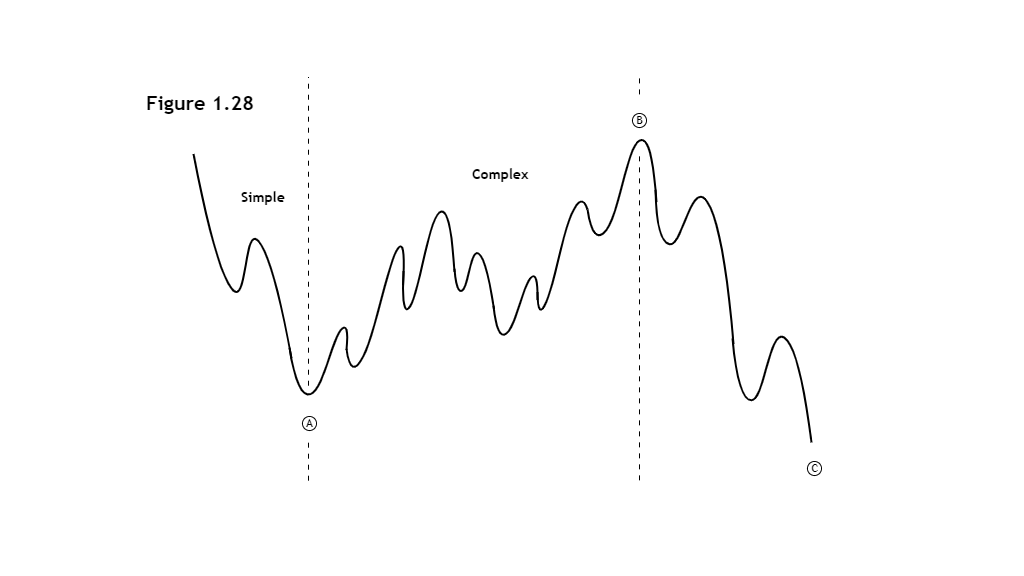
For example, if wave A started out simple, then wave B is more complex than wave A, then the analyst can expect that Wave C will be even more complex, and vice versa.
In general, two of the five motive waves will tend to be equal in terms of price and time. Waves one and five are likely to be of equal length, or if wave five is the extension. Waves one and three are usually the same length and so on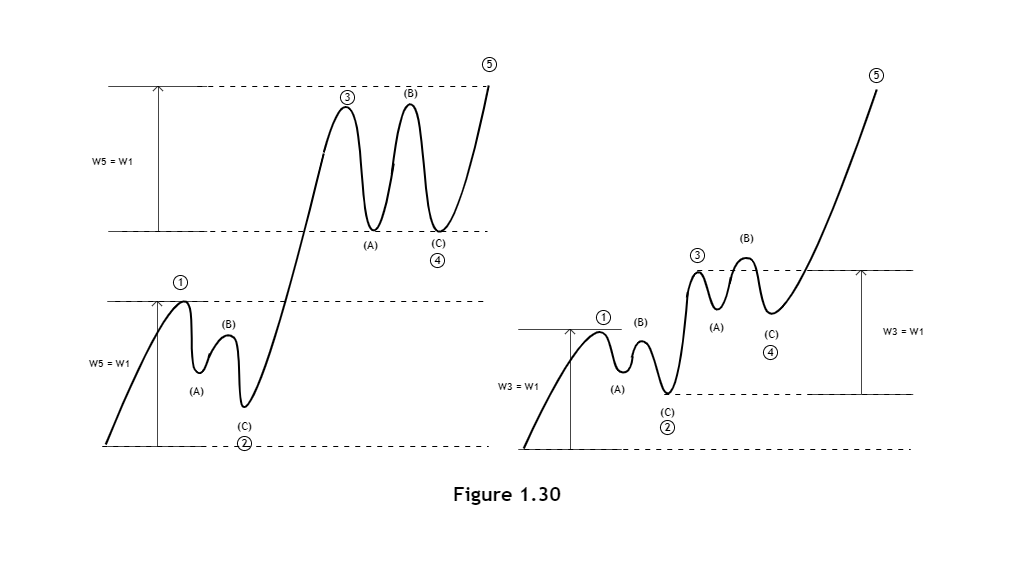
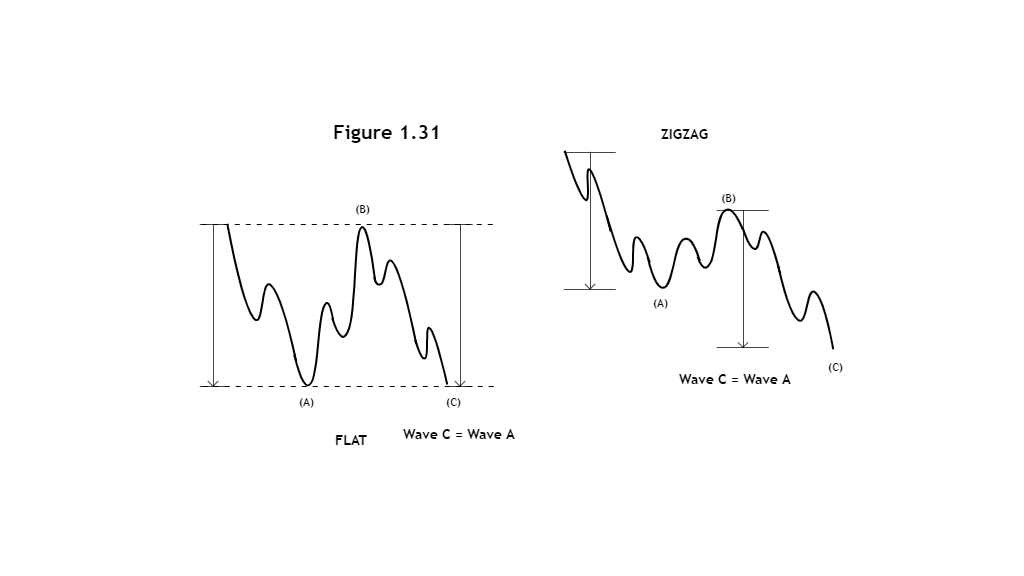
As for corrective waves, wave C is usually the same length as wave A.
.
The parallel channel technique is an extremely valuable analytic tool which can be used to distinguish wave states or forecast price targets for Motive waves including Base Channel, Acceleration Channel, and Deceleration Channel Elliott Waves.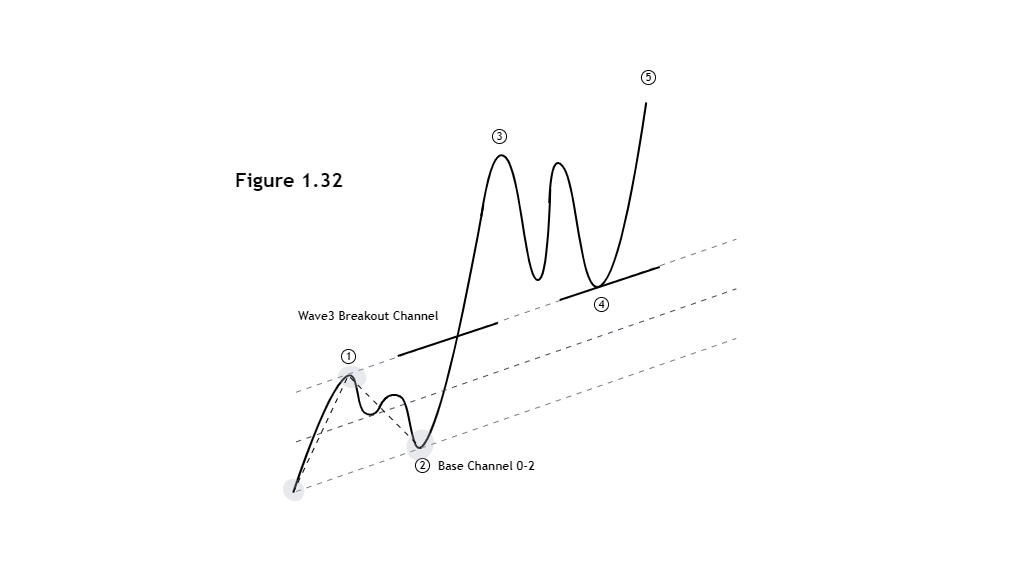
The use of base channels is an attempt to try and simply Elliott Wave analysis. Here, you draw a trend line from the beginning of wave one to the end of wave two. Then draw a parallel line at the end of one wave, we get the Base Channel. This helps with wave counting which facilitates proper identification.
Notice
To create this channel, draw a trendline from the end of wave one to the end of wave three. Then draw a parallel line at the end of wave two. We get the Acceleration Channel, which is used to predict the end of wave three. and predict the extent of the four waves
Notice
- If the price breaks the channel, it is possible that wave three will end.
- The fourth wave should have a section breaking out of the channel or touch the bottom line at least If it hasn't been touched, chances are that wave four hasn't ended yet.

To create this channel, draw a trendline from the end of wave B to the end of wave B. Then draw a parallel line at the end of wave A. We get the Deceleration Channel, which is used to predict the end of wave four.
Notice
- If the price breaks the channel out above, it is possible that wave four will end.
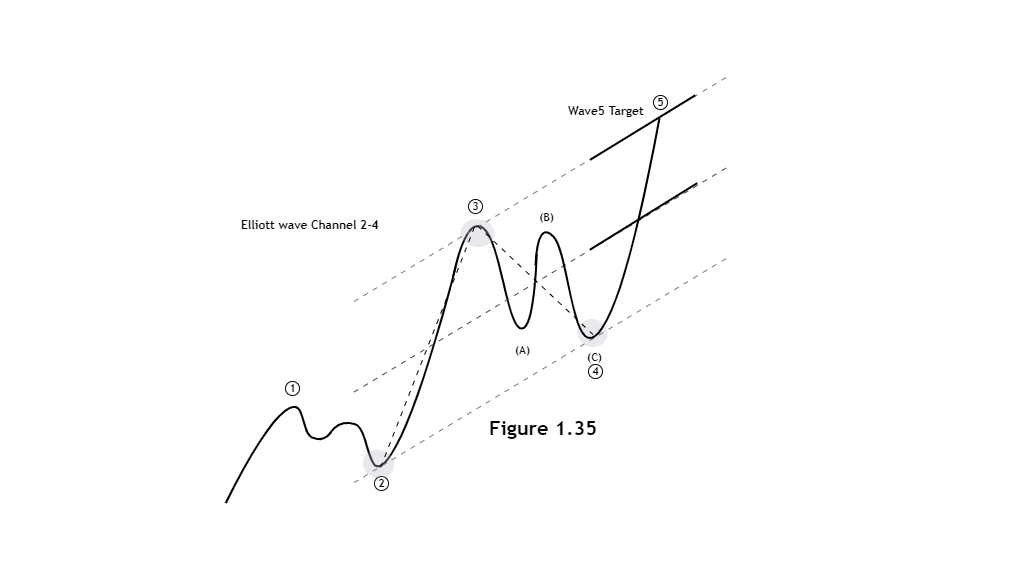
To create this channel, you draw a trendline from the end of wave two to the end of wave four. Then draw a parallel line at the end of wave three. We get the Elliott wave Channel, which is used to predict the end of wave five.
Notice
- Usually, the price touches the top line, which can be used to predict the target price of wave five.
- The shortest five waves usually reach the middle line. If not, there is a chance that wave five may not be over yet.
In addition to impulse waves, this approach can also be used with Corrective Waves because most of the corrective waves are moving.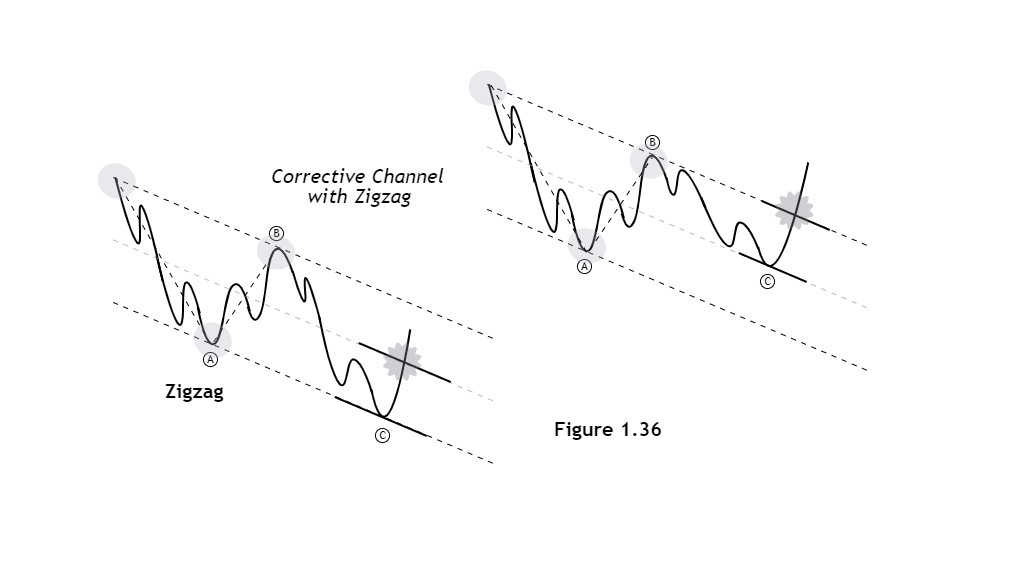
To create this channel, draw a trendline from the beginning of wave A to the end of wave B and draw a parallel line at the end of wave A in the same way as the Deceleration Channel is used to predict the end of Wave C.
Notice
- If wave C touches the bottom line When the price closes above the center line of the parallel channel It is possible that wave C may be over.
- If wave C does not reach the bottom line but must reach the center line of the parallel channel and when the price closes above the upper line, it is possible that wave C may have ended.
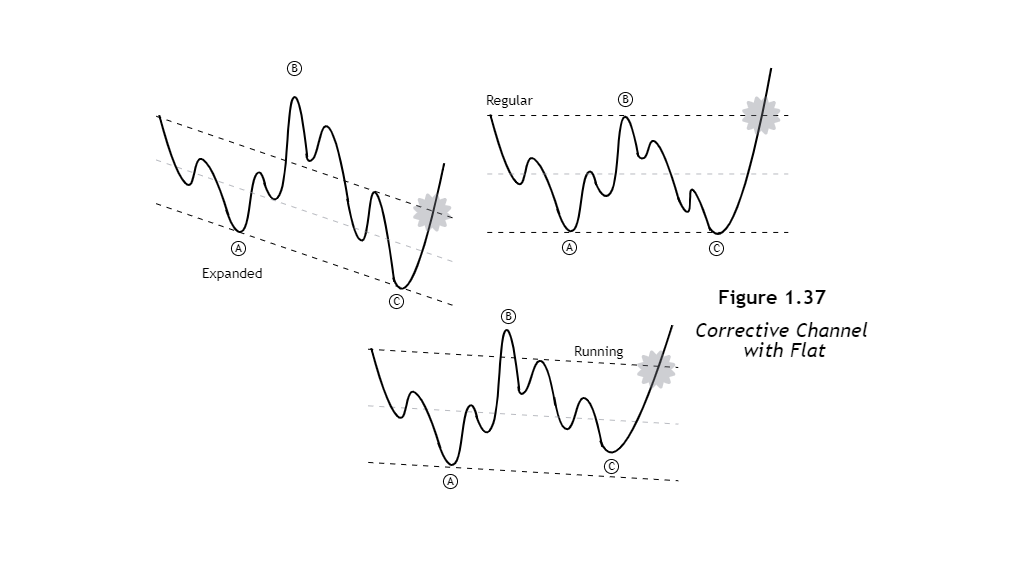
In a normal flat with an ending no more than the beginning of wave A, draw a trendline from the beginning of wave A to the end of wave B and draw a parallel line at the end of wave A. It is an Expanded Flat or Running Flat where wave B exceeds the origin of wave A. We can channel parallel by drawing a trendline from the beginning of wave A to the end of wave two or wave four subs of wave C, and draw a parallel line at the end of wave A.
Notice
- If wave C touches the bottom line When the price closes above the center line of the parallel channel It is possible that wave C may be over.
- If wave C does not reach the bottom line but must reach the center line of the parallel channel and when the price closes above the upper line, it is possible that wave C may have ended.
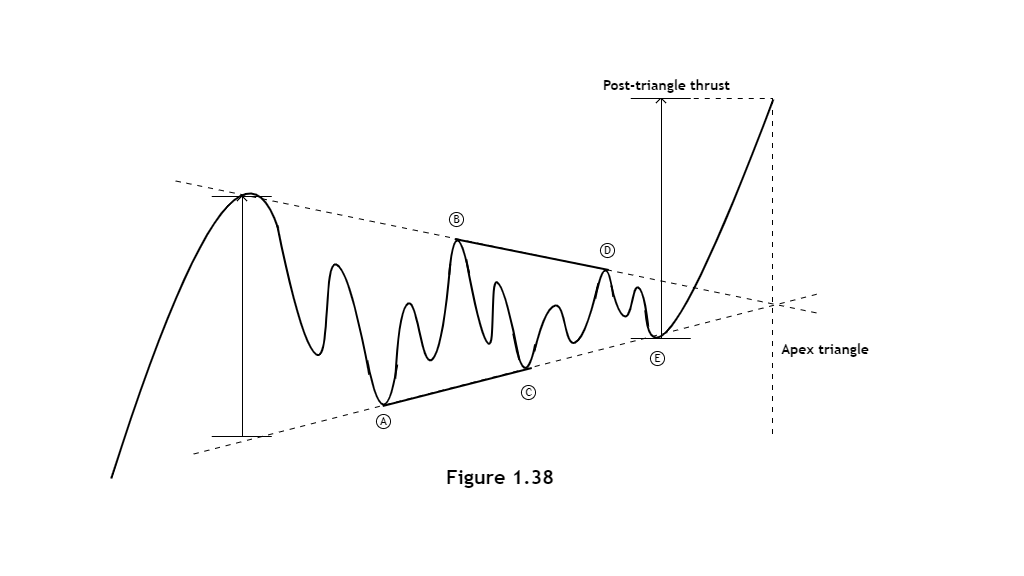
In the Triangle pattern, this is a sideways movement with a contraction in price. Therefore, to channel the prices, we start by drawing a trendline from the end of wave B to the end of wave D and drawing another trendline from the end of wave A to the end of wave C to determine the point. end of wave E and determine the magnitude of the thrust after the Triangle pattern.
Notice
- If wave E can exceed the trendline A-C, but not below the end of wave C.
- Key point to confirm the end of the triangle pattern. is when the price exceeds the end of wave D.
- Triangle thrust can be measured by measuring the widest range of the triangle. It starts from the beginning of wave A and moves up to the trendline B-D to compare the next wave series after wave E ends.
- The next wave usually ends at the intersection of lines A-C and B-D.
This is a thing that an Elliott Wave Analyst will be called upon to do frequently. It is used as a guide to predict the depth of the corrective wave in the fourth wave and the correction of the corrective wave after the fifth wave.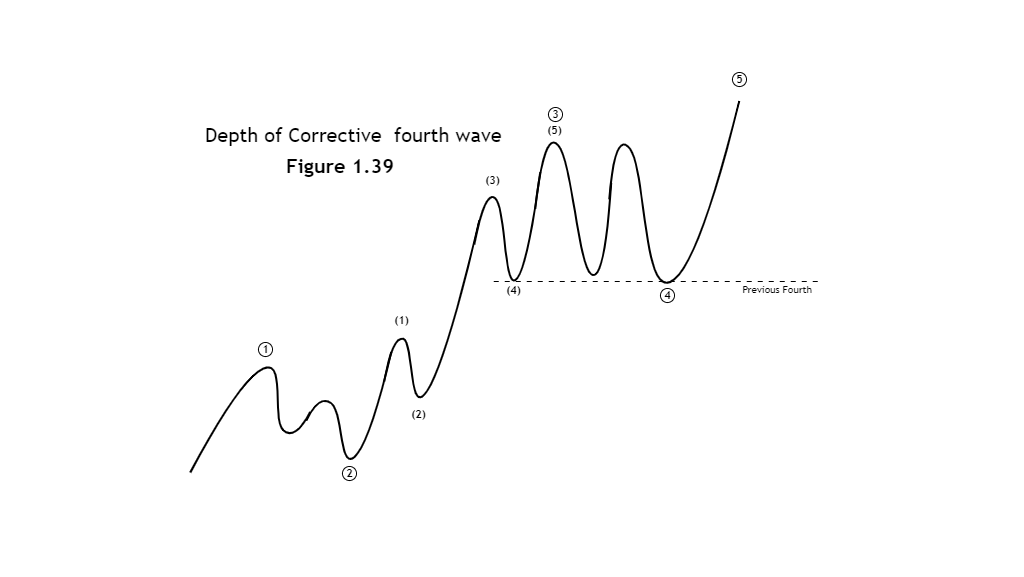
The fourth wave tends to revert to the sub-fourth wave of the third wave at the same level. But sometimes in the case of one extension wave or as a diagonal triangle, wave four tends to descend to wave two subs of wave three in the same degree Behavior Following Fifth Wave Extension.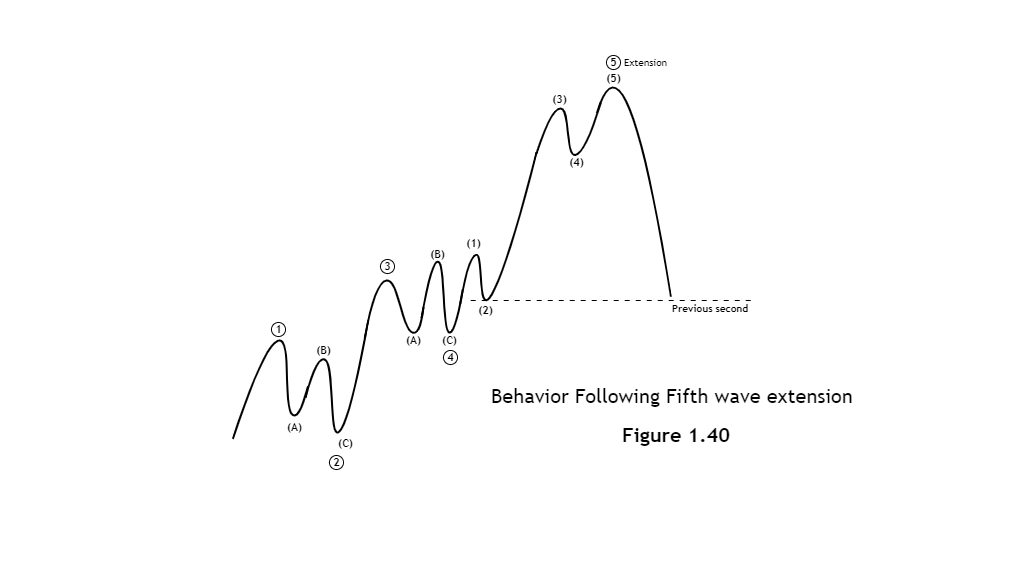
The behavior that follows after the end of the extended fifth wave is generally a quick and intense downturn.
Each Elliott wave expresses a trader's emotional state in the market. There is fear, greed, confusion, and extreme positive or negative emotions. Wave personality thus significantly expands wave principle by reflecting public psychology. Use this as an additional layer of guidance when identifying waves for greater accuracy.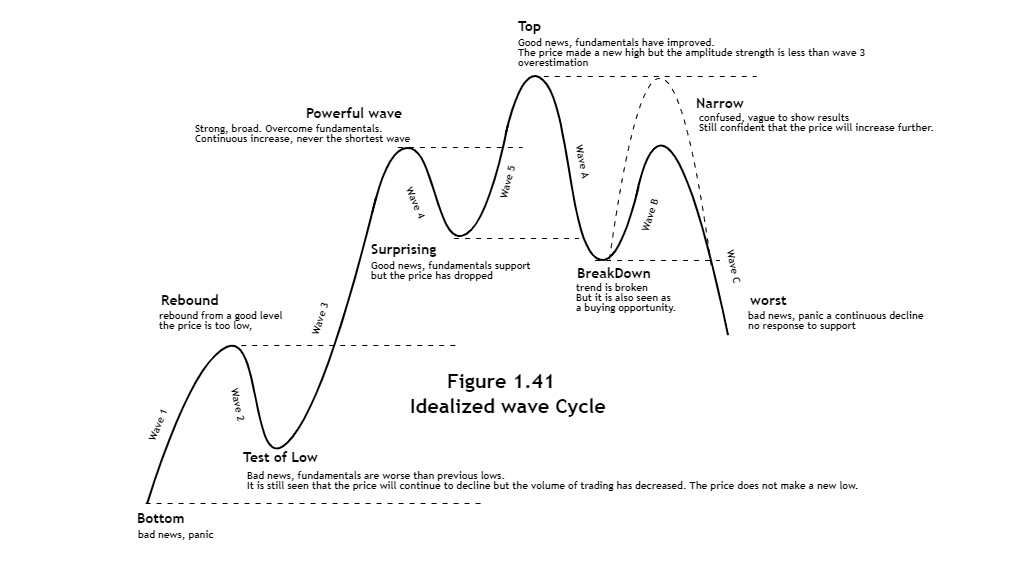
- First wave - Wave 1: The first wave is the base process. It is early in the trend so there is a chance of a strong reversal from wave two, especially as there will be some market traders who think the previous trend is not over yet. This wave is often subjected to such strong resistance that internal waves overlap. The first wave usually increases more than half of the previous wave and only a moderate reversal will occur.
- Second wave - Wave 2: Often strongly reverses. At this point, investors tend to I am fully convinced that the previous trend can resume. Until the price is unable to travel past the beginning of wave 1, the volatility and volume decrease. The trend is thus changing.
- Third wave - Wave 3: It is fast-forming wave that takes less time to expand the area and has a wide price range (as a rule). It shows a clear trend and is the center or midpoint of good news. This wave generally amplifies the Impulse series, though from this point onward, analysts can expect to see volatility increase.
- Fourth wave - Wave 4: This wave is generally predictable in both depth and form because Alternation should be different from the previous 2 waves of the same level. Often it extends laterally to create a base for wave 5’s motion.
- Fifth wave - Wave 5: This wave generally exhibits a slower speed of movement and change. Although wave 5 is an amplified wave, the speed of change in a Wave triad of Wave 5 may take more time than Wave 3 on the same scale as Wave 5. Wave 5 is optimistic but although Wave 5 can reach new heights, it is always less dynamic than wave 3 in terms of price and time.
- “A” wave - Wave A: Investors tend to believe it's just a pullback in price to keep going. But the price will fall again in wave C, wave A will determine the trading volume of wave B.
- “B” wave - Wave B: It's fake, it's an ugly drama. This wave is usually filled with confusion little to no technical hardness. It is an interlude that exists between Wave A and Wave C, which will move in the same4 direction as A.
- “C” wave - Wave C: It has most of the properties of Wave 3. The illusion created by waves “A” and “B” disappears, fear takes over. Wave “C” is always continuous and wide.
- “D” wave - Wave D: This is a triangular extension. Usually comes with increased trading volume. This may be because wave “D” has a characteristic between corrective wave and wave 1, because wave “C” is completely irreversible and wave “D” cannot peak above wave “B” and therefore is counterfeit as well. wave “B.”
- “E” wave - Wave E: This wave will manifest in a triangle pattern and will look to most market watchers like the dramatic start of a big trend (and often there is a lot of news to support this conclusion). This intensifies the sentiment of the market participants for the movement, so wave “E” will resemble Wave 5.
Leonardo Pisano (c. 1170 – c. 1240–1250), also known as Leonardo Pisano, or Leonardo Fibonacci, or simply Fibonacci for short, was an Italian mathematician. He is most famous for the discovery of the Fibonacci number, and played a role in disseminating the writing and computation of the current Arabic positional decimal system.
Many people praised him as being the best, or at least the most significant mathematician in the Middle Ages.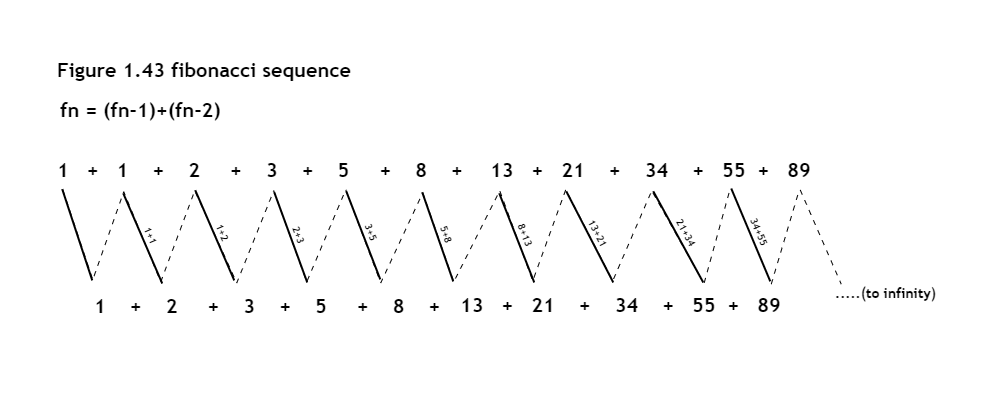
The Fibonacci number is any number in the sequence of positive integers starting from 0, as follows:
Fn = (Fn-1)+(Fn-2).
This equation is always true. When the current number is equal to the sum of the two previous numbers As shown in the picture 1.43
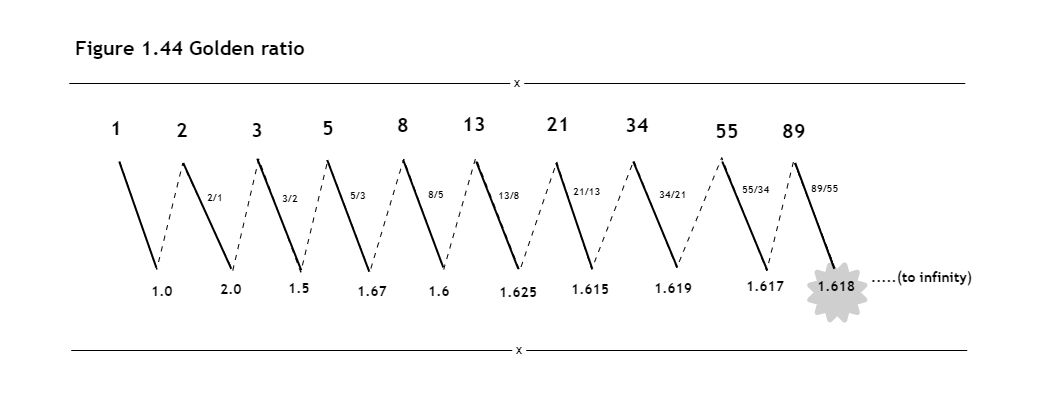
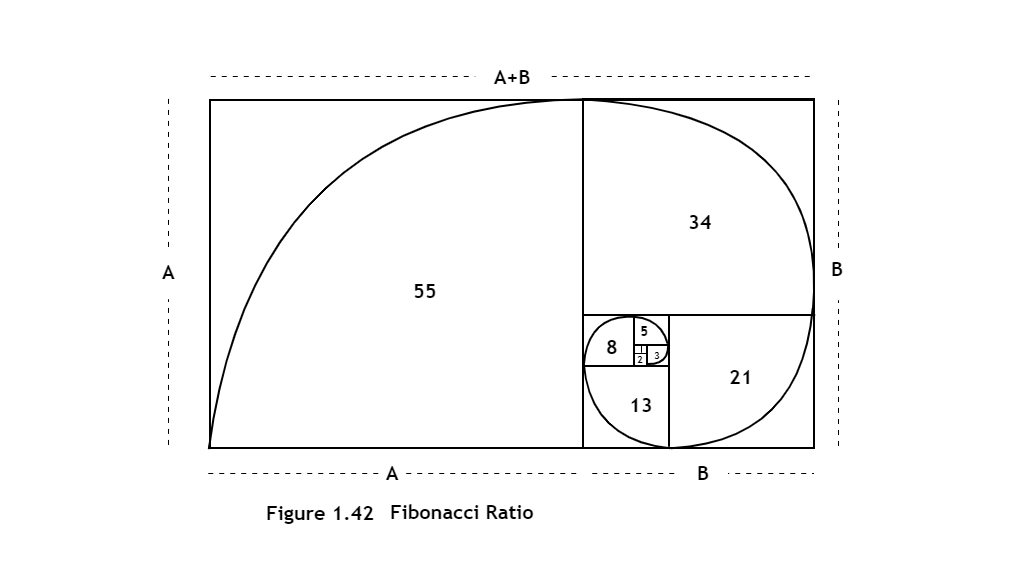
Mathematicians discovered that the Fibonacci number sequence Corresponds to a number called phi. Phi (φ) is a fixed number 1.618. Of interest, if you divide any number in the Fibonacci sequence by the number that comes before it, you get a value quite close to Phi, and from the 12th number in the sequence and beyond, you get exactly Phi.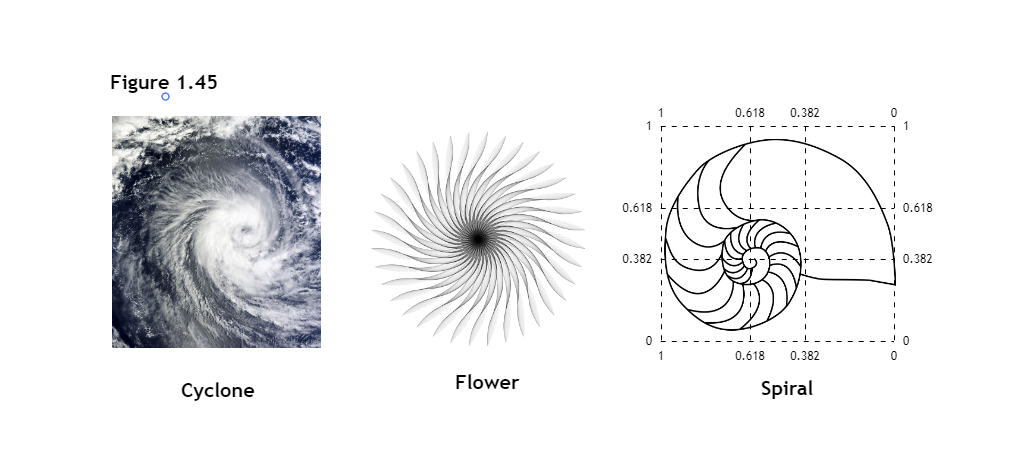
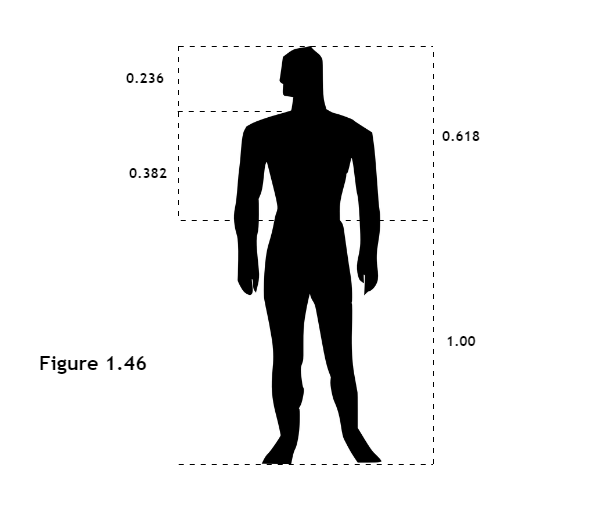
Even more interestingly, you find the Golden Ratio in almost everything. It’s in art and the proper proportion of the human form. It’s in the arrangement of flower petals or lines on seashells. It’s in the shape of hurricanes. The Golden Ratio is as close to a universal constant as you’re likely to find.
You can do some fairly fun things with this that relate back to Elliott Wave Theory. For example, if you draw straight lines from several points of the innermost spiral so as they intersect the curve of the spiral, the angle formed by the straight line and the tangent to the curve at its intersection is always equal. Angle A = Angle B = Angle C.
Also, if you study the curve of say, pineapple buds, you’ll find that the curves have exactly five lines that rotate counterclockwise and three that rotate clockwise. Where have we seen these numbers before?
R.N. Elliott said, “All human activity has three distinctive characteristics: form, time, and ratio, and they all follow a series of sums of Fibonacci numbers.” The author understood that Fibonacci numbers are inseparable from Wave Theory.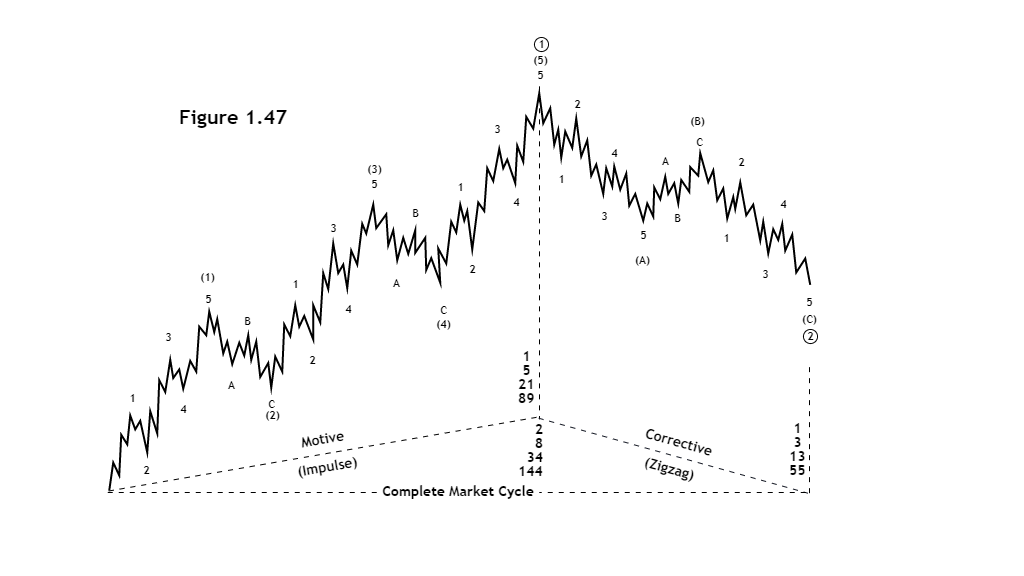
One complete cycle consists of a sequence of (Fibonacci) numbers. For example, if we count the Motive waves from the largest and smallest waves, we get 1,5,21,89…. Corrective wave we get order 1,3,13,55… and add the two sides together we get 2,8,34,144… so we can't deny the connection between Fibonacci numbers and Elliott Wave Theory.
Fibonacci Numbers themselves, however, are of limited value to an analyst. Much more important are key ratios derived from these numbers. For example, 61.8% is obtained by dividing one number
in the series by the numbers that follow. For example, 21 divided by 34 equals 0.6176, and 55 divided by 89 equals approximately. 0.61798 The 38.2% ratio is discovered by dividing the numbers in the dataset by the number to the right by two points.
Here’s a bit of shorthand to keep near the forefront of your mind:
1.0 - 0.618 = 0.382
0.618 x 0.618 = 0.382
1.0 / 2 = 0.50
Square root of 0.618 = 0.786
0.618 is the reciprocal of 1.618
The square root of 1.618 = 1.272
0.618 - 0.382 = 0.236
0.382 x 0.618 = 0.236
1.618 x 1.618 = 2.618
2.618 x 1.618 = 4.236
Fibonacci ratio can be used to estimate the scale of a wave.
.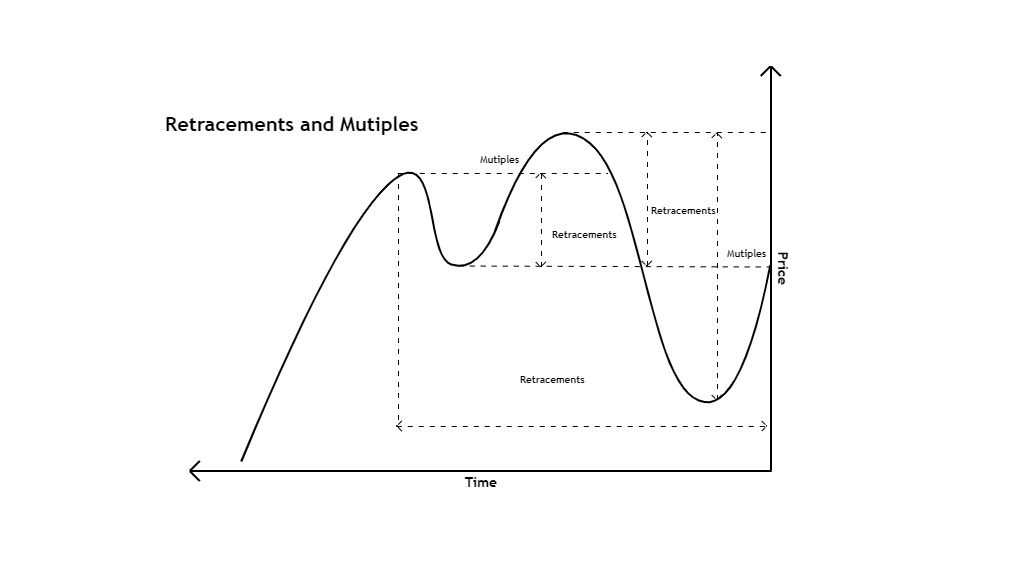
The inverse relationship of key Fibonacci ratios to the Elliott Wave becomes apparent when analyzing wave forms over time.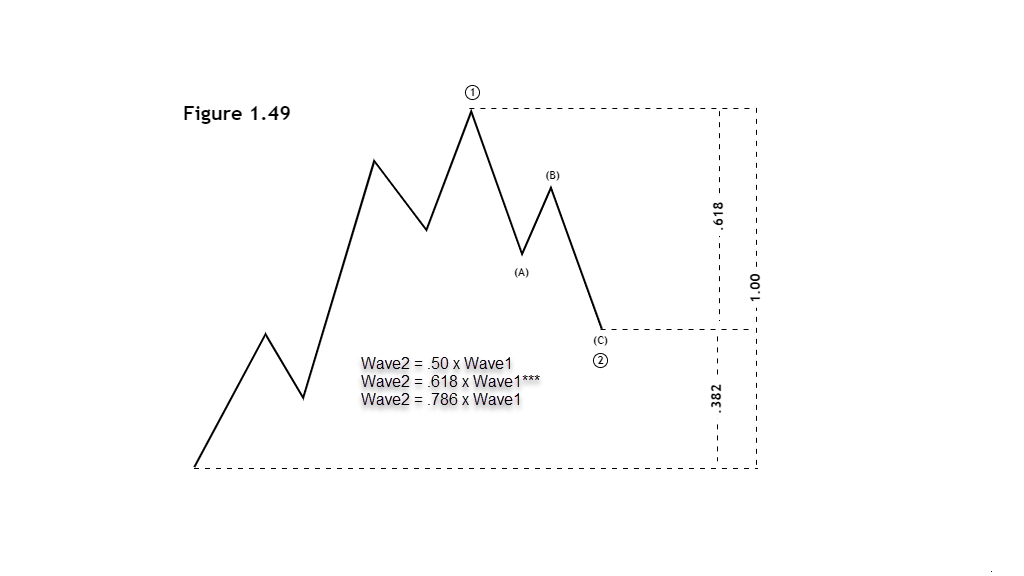
in terms of reversing the second wave, it generally retraces to the .618 level of the first wave, creating a deep retracement that characterizes the second wave. or sometimes at the .50 level, but in the event that the first wave is a diagonal, wave two is usually reversed to the .786 level of wave one. So, looking for the second wave retracement level is between .50 - .786, but the .618 level is the most common.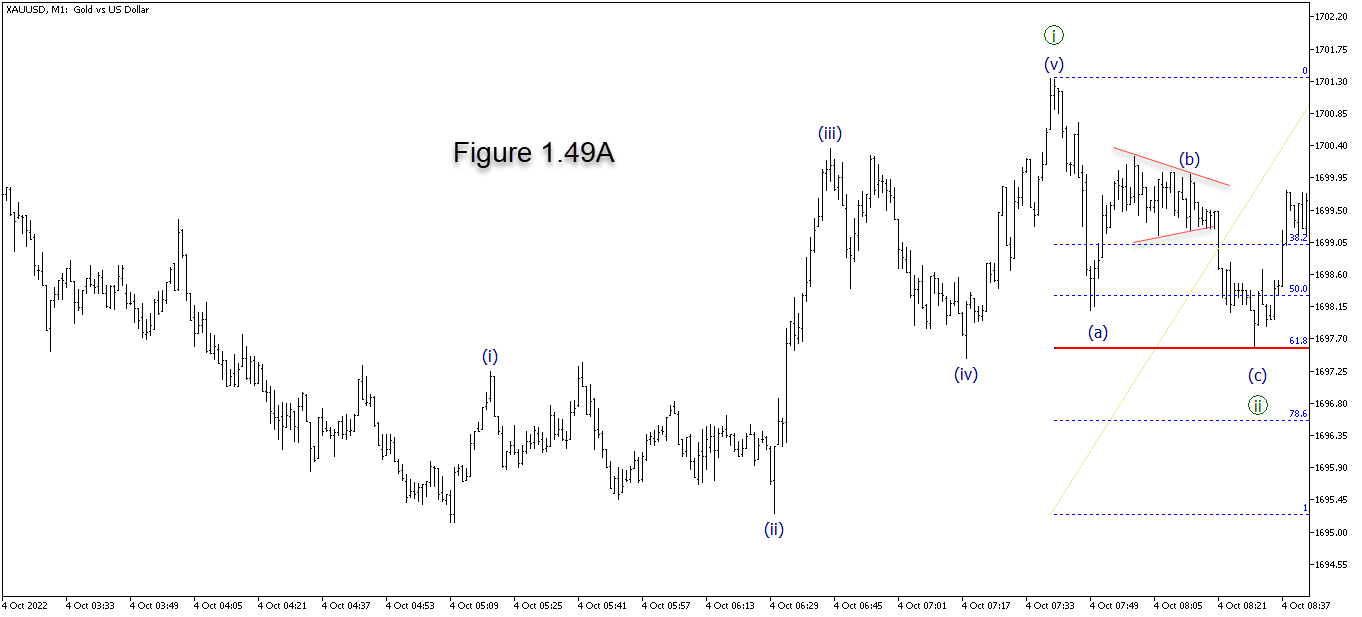
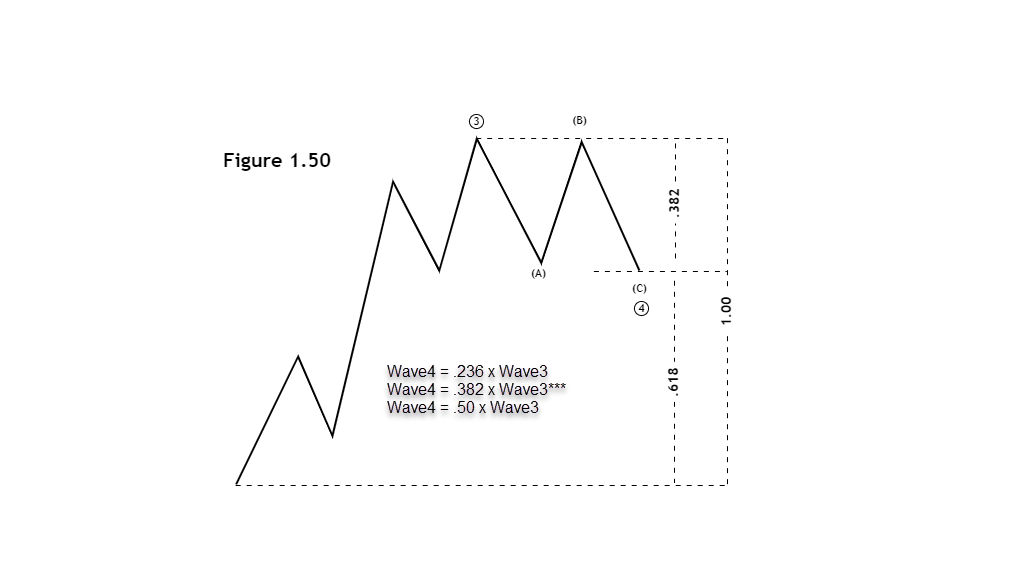
In most cases, the Fourth Wave is not a deep reversal. You can expect to see it revert to the .382 level with a Flat or Triangle pattern, or sometimes end at the .236 level, but if the fourth wave is a Zigzag pattern, it may reverse as much as .50 and by much will not exceed .618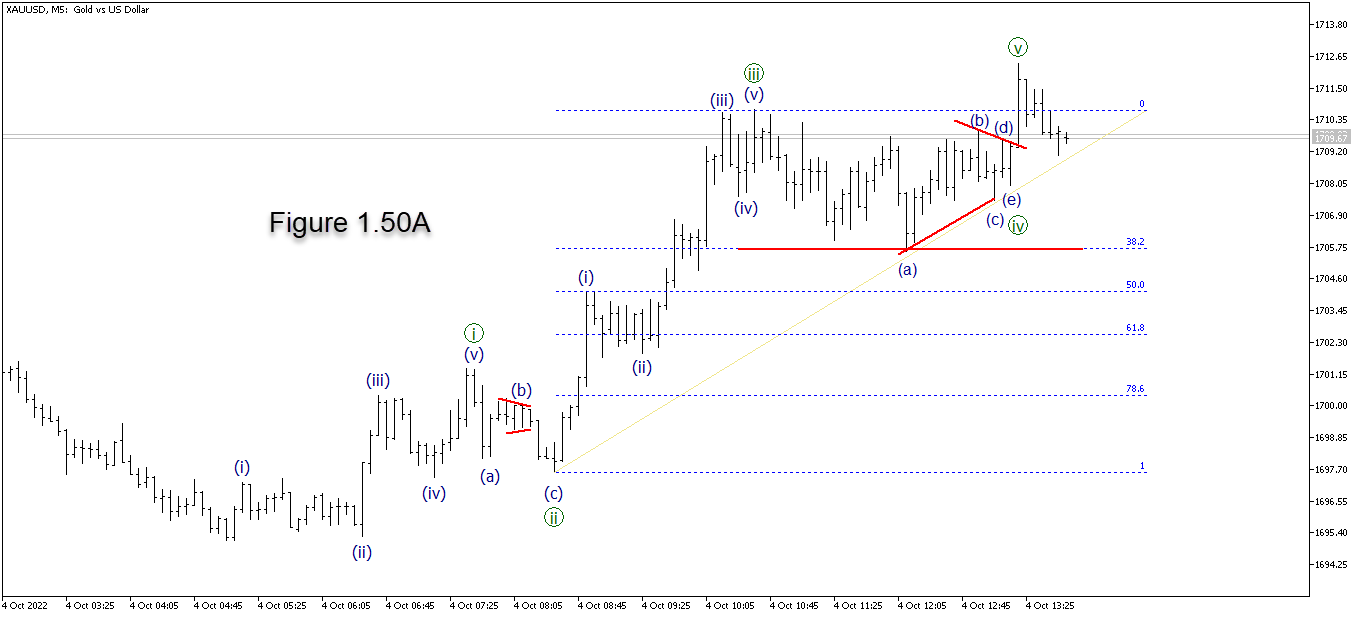
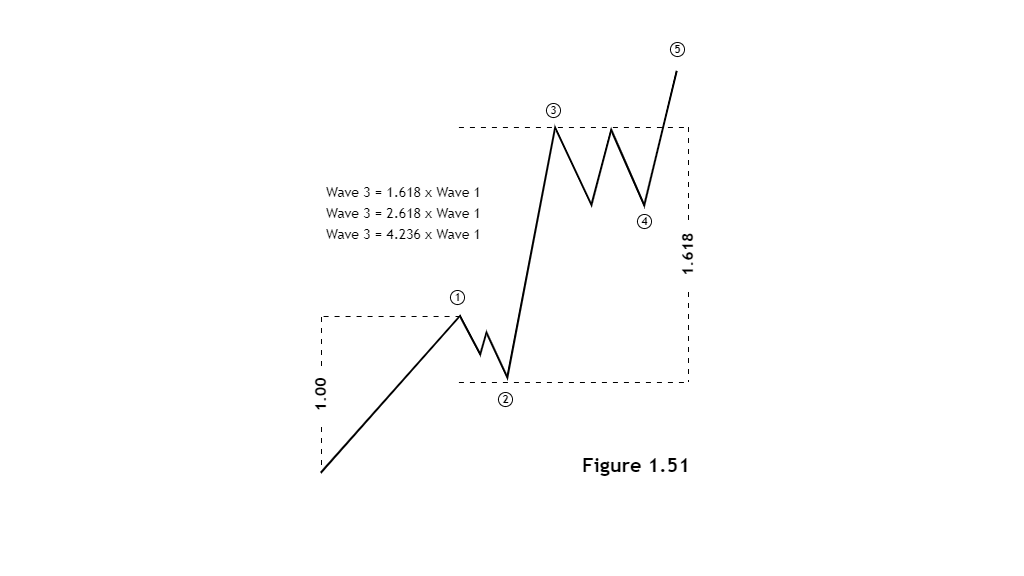
Rich in news and fundamentals that push the third wave to expand, this is almost always the most interesting and dynamic wave in a set. Wave three is typically either 161.8 or 261.8 longer than Wave 1, but at extreme amplifications you’ll find it as large as 423.6.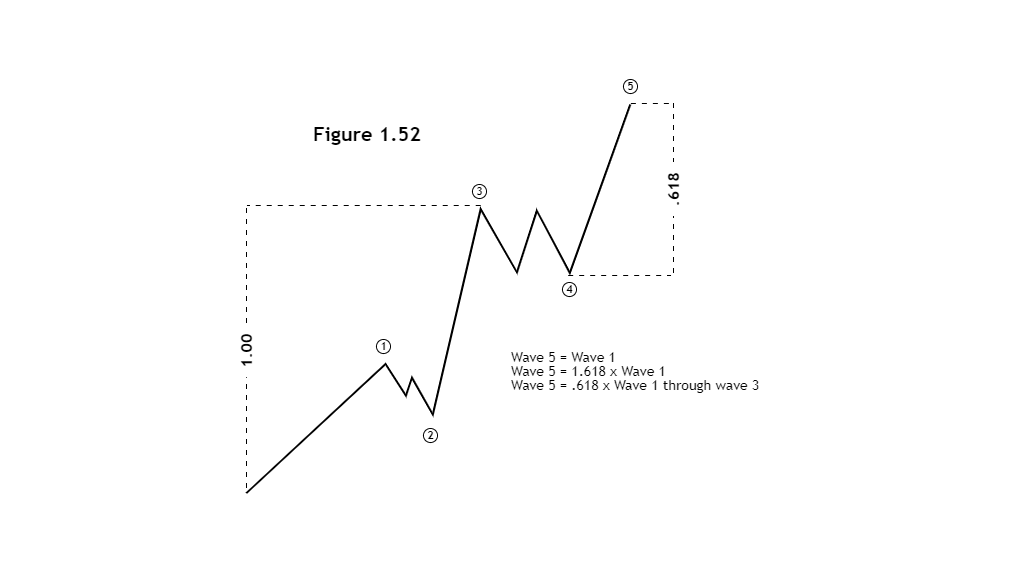
Wave five is the last wave in an impulse wave, so the sequence of relationships includes waves one, three, and four, usually of the same length as wave one. or length equal to 1.618 of a wave, but the most common relationship is usually .618 of wave one to wave three. In some cases, Wave Five is truncated, and will be a minimum of 78.6 of Wave 4.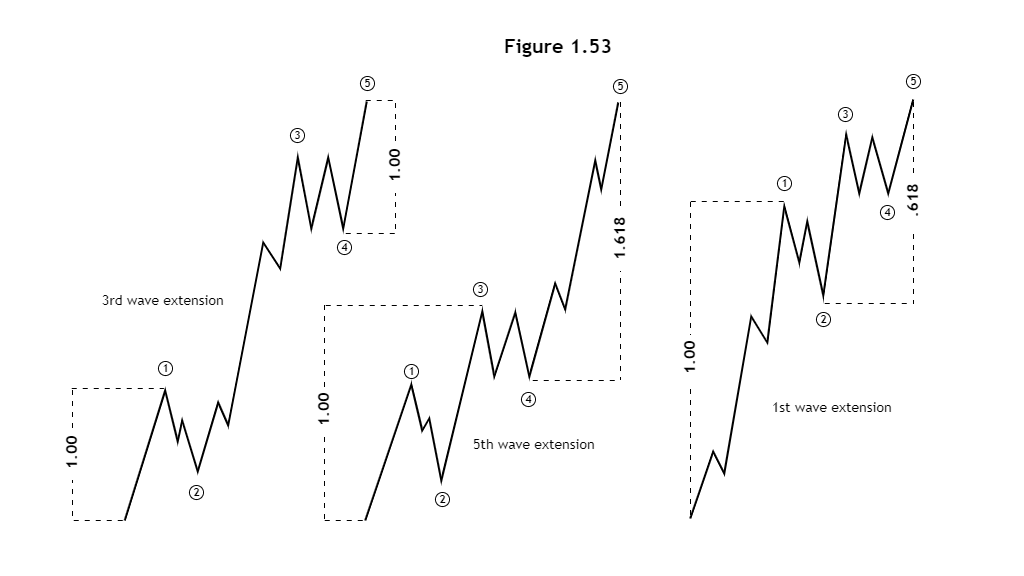
In most cases, if wave 3 is an amplified wave, then wave 1 and wave 5 tend to be equal, but if wave 5 is extended it is usually 1.618 x the length from the beginning of wave 1. to the end of wave 3 And in the event that wave 1 is amplified, the sum of wave lengths 3 and 5 tends to be equal to .618 x wave length 1.
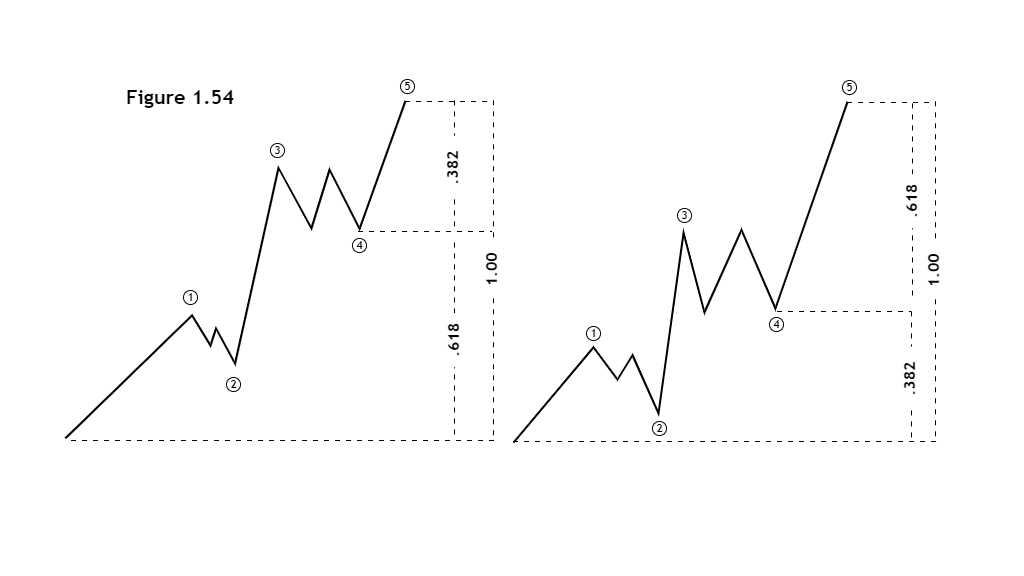
Another common relationship between the golden ratio and impulse waves is that the fourth wave usually divides the impulse wave into the golden ratio.
In the example shown in illustration 1.54, it can be seen that if we measure from the end of the fourth wave The widest range of the impulse wave is usually .618 and the rest is usually .382, which is very helpful in predicting the fifth wave's target price.
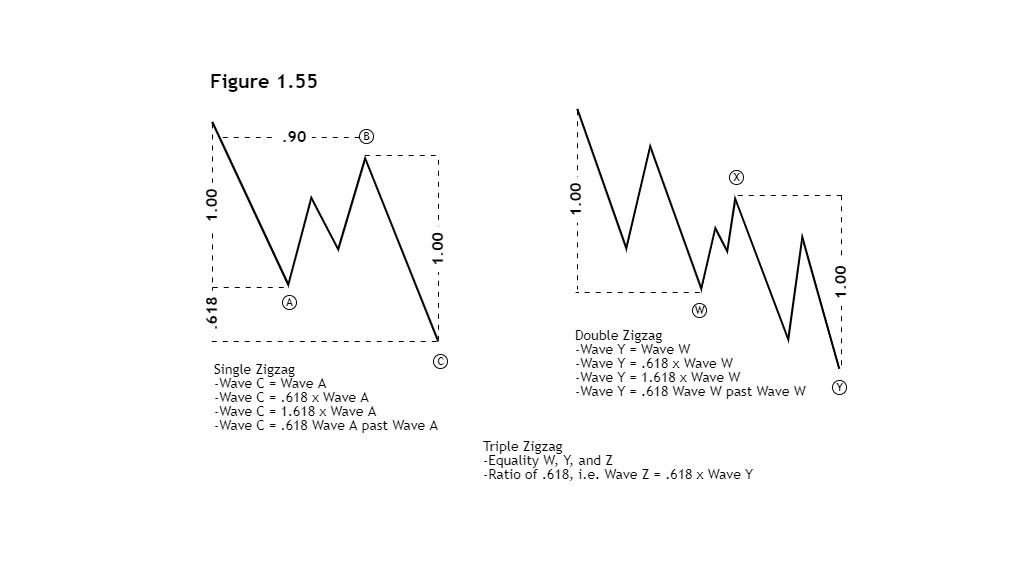
A Zigzag's correlation between wave ABC and wave B reverses between 10 and 79%, although R.N.Elliott said that Zigzag wave B reverses no more than the beginning of wave A, but most reverses more than 90%.
This is usually a reversal of wave B in a flat pattern and we will find that if wave B is a zigzag there is often a retracement between 50-79% of wave A. To find a price target for wave C, look for an equality. Wave A first and the rest are usually the golden ratio, even in Double or Triple Zigzags.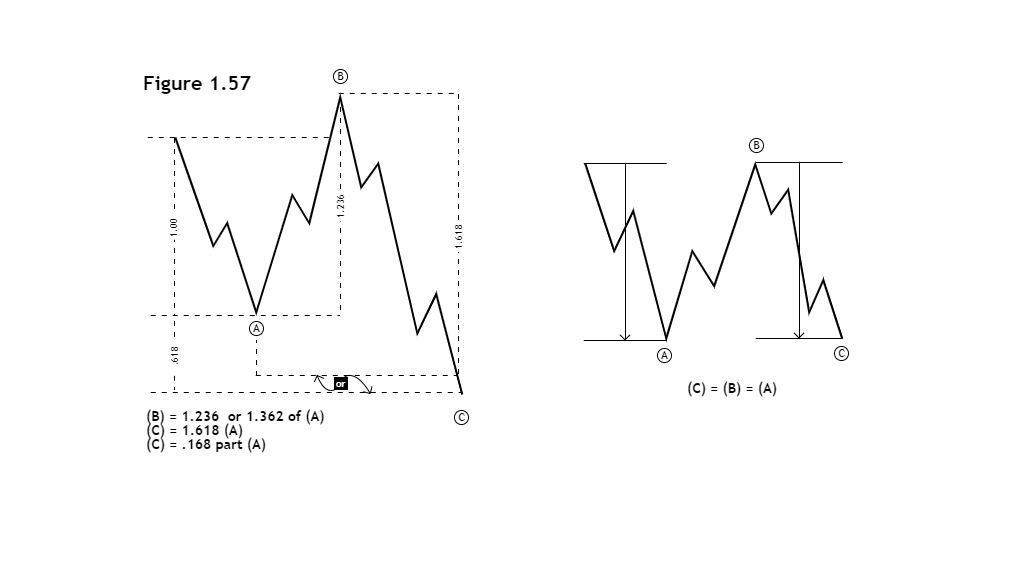
In Flat, Regular Flat, Wave ABC is always of the same length or Wave C = Wave A, In Expanded Flat Wave B = 1.236 x Length of Wave A and Wave C = 1.618 x Length of Fibonacci Wave A. Extension or Wave C = 1.618 x Wave A or Wave C = 1.382 x Wave A Fibonacci Projection Usually in wave B of which the reverse is greater than the beginning of Wave A exceeds 1.618 and Wave C is the shortest in the Running Flat. should be not less than 61.8 of wave B.
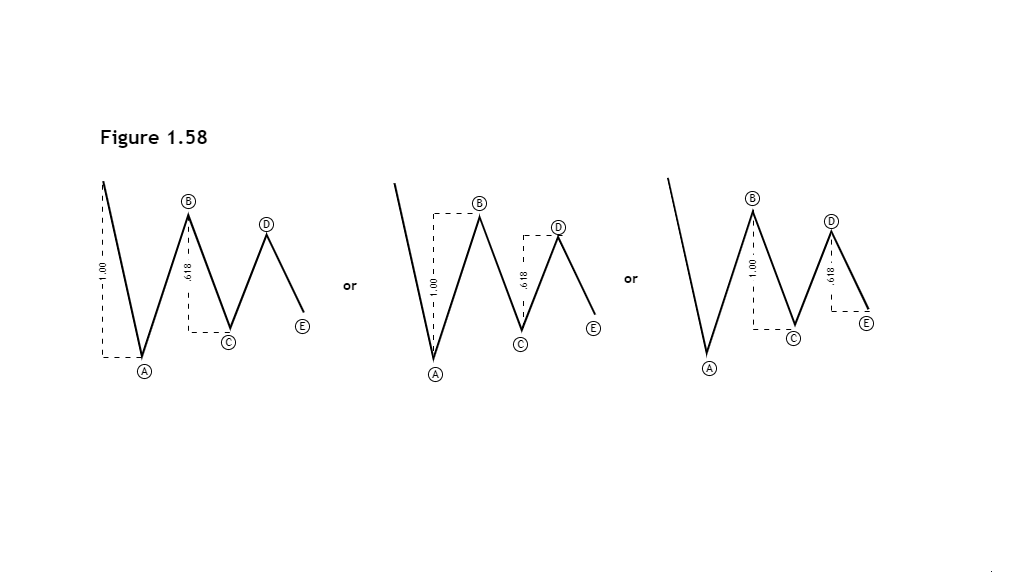
In contracting triangle patterns, Fibonacci ratios are often correlated with reversals relative to the previous wave between .618 - .786.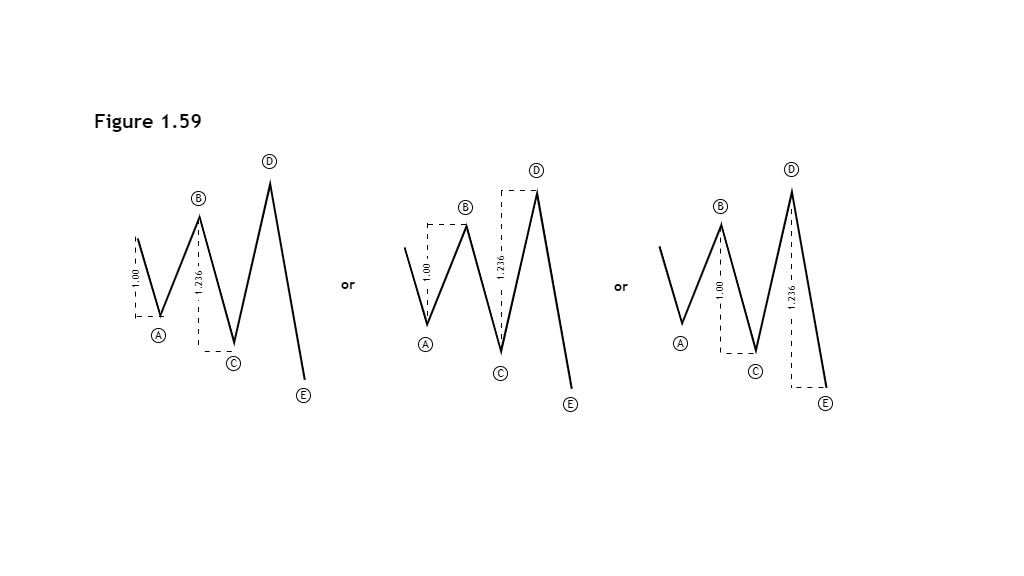
In an Expanding Triangle pattern, subwaves B, C and D each reverse at least 100 percent but not more than 161.8 percent of the previous subwave.
Fibonacci time ratio analysis is an analysis of time factors that are related to Fibonacci ratio and time spent on each wave which is a measurement to the side.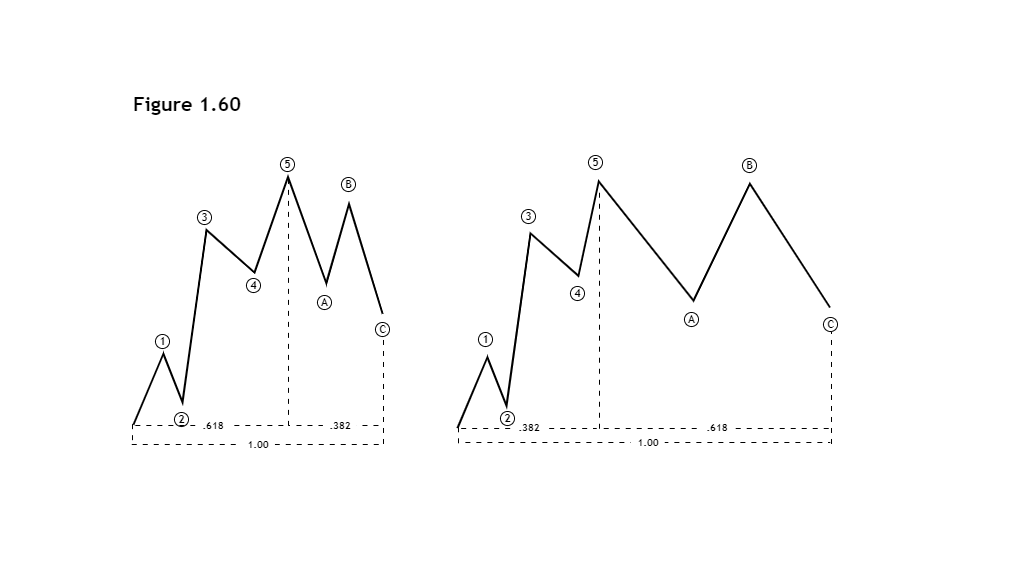
We often find relationships between waves exist in a range between .382 or .618. For example, if the preceding wave set is .618 width, the next wave set is usually .382 width of the two waves combined.
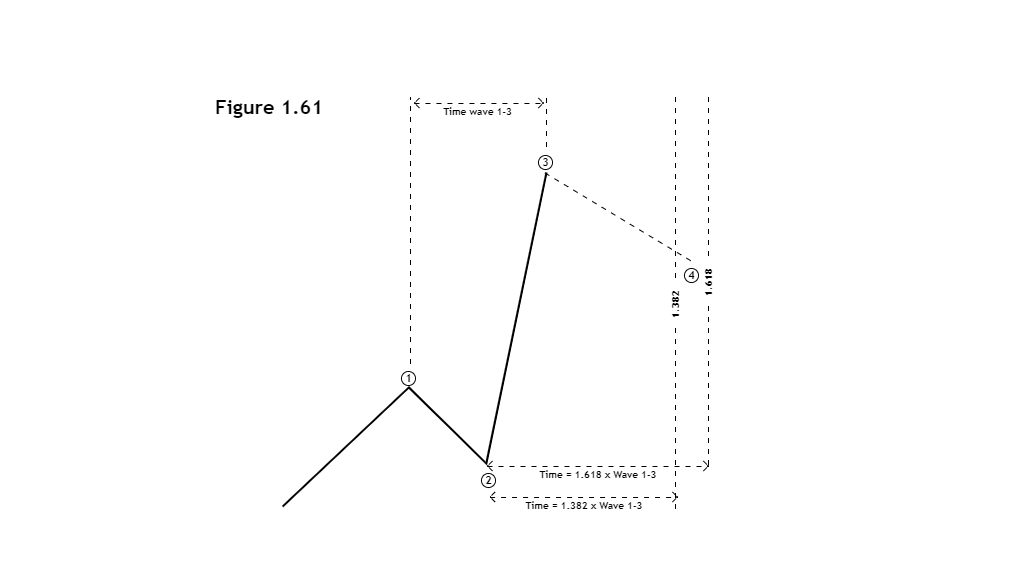
In predicting the end time of wave 4 starting from the end of wave 2, it is often the case that wave 4 will end near The period from the end of wave 1 to the end of wave 3 is multiplied by 1.382 or 1.618.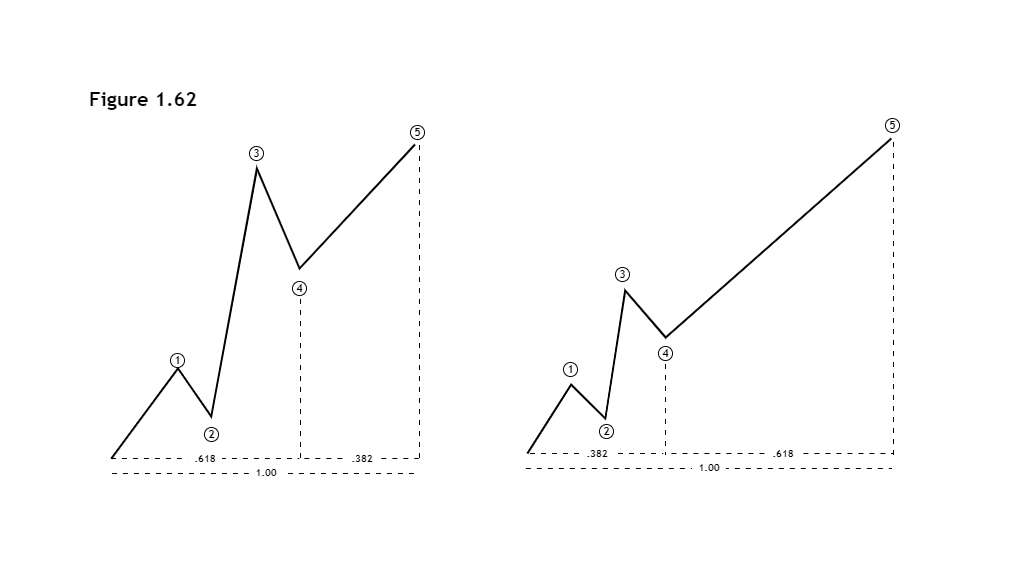
As with the price-time relationship, wave 4 usually divides wave 5 into Fibonacci proportions, the widest part being .618, the rest being .382, as shown in 1.62.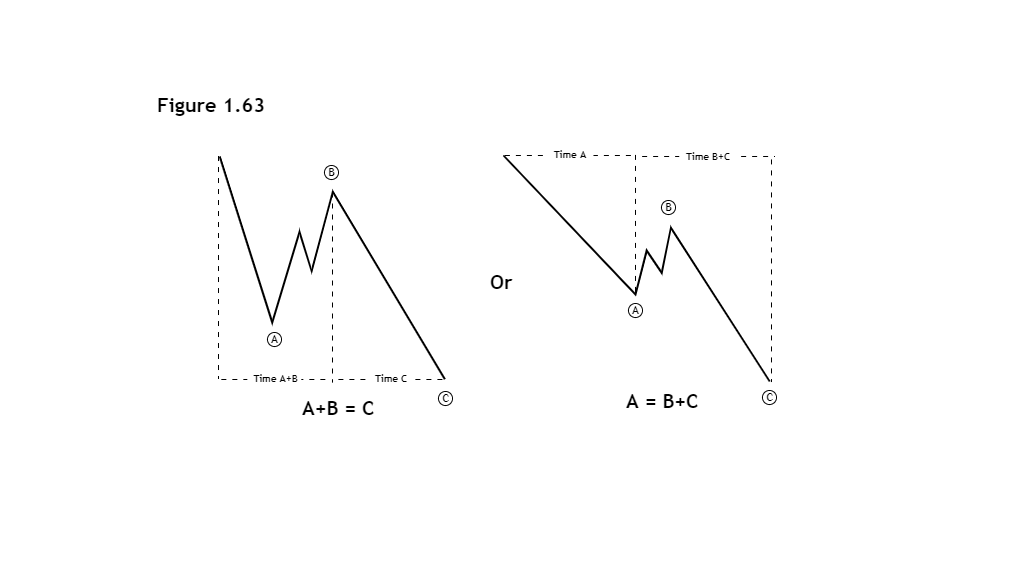
The time of wave A + wave B is often equal to the time of wave C, or sometimes It will be wave A that takes more time than the time of wave A = B+C.